Welcome to 100 Days Of Kubernetes!
100 Days of Kubernetes is the challenge in which we aim to learn something new related to Kubernetes each day across 100 Days!!!
You Can Learn Anything
A lot of times it is just about finding the right resources and the right learning path.
What can you find in this book
This book provides a list of resources from across the cloud native space to learn about and master Kubernetes. Whether you are just getting started with Kubernetes or you are already using Kubernetes, I am sure that you will find a way to use the resources or contribute :)
Just a note of caution
The notes in this book depend on the community to improve and become accurate. Everything detailed so far is someone's personal understanding at each point in time learning about the respective topics.
Help us improve the notes.
100 Days Of Kubernetes
So what is this challenge all about? The idea (and credit) goes to two existing communities :
The idea is that you publicly commit to learning something new. This way, the community can support and motivate you. Every day that you are doing the challenge, just post a tweet highlighting what you learned with the #100DaysOfKubernetes hashtag.
Additionally, creating your own content based on what you are learning can be highly valuable to the community. For example, once you wrote a blog post on Kubernetes ReplicaSets or similar, you could add it to this book.
The goal is to make this a community-driven project.
Where to get started
Fork the example repository We suggest you to fork the journey repository. Every day that you work on the challenge, you can make changes to the repository to detail what you have been up to. The progress will then be tracked on your GitHub.
Tweet about your progress Share your learnings and progress with the #100DaysOfKubernetes on Twitter.
Join the community We have a channel in this Discord channel -- come say hi, ask questions, and contribute!
Contribute
You can find more information on contributions in the README of this GitHub repository.
Structure of the book
The book is divided into several higher-level topics. Each topic has several sub-topics that are individual pages or chapters.
Those chapters have a similar structure:
Title
The title of the page
100Days Resources
This section highlights a list of community resources specific to the topics that is introduced. Additionally, this is where you can include your own content, videos and blog articles, from your 100DaysOfKubernetes challenge.
Learning Resources
A list of related learning resources. Different to '100Days Resources', these do not have to be specific to 100DaysOfKubernetes.
Example Notes
This section provides an introduction to the topics. The goal is to advance each topics over time. When you are first time learning about a topic, it is usually best to take your own notes but sometimes having a starting point and examples is helpful.
List of Example Notes by the Community
About the contributors
If you have contributed to this book, please add yourself to the list :)
Anais Urlichs
What is Kubernetes and why do we want it?
100Days Resources
- Video by Anais Urlichs
- Add your blog posts, videos etc. related to the topic here!
Learning Resources
Example Notes
Kubernetes builds on Borg and the lessons learned by Google for operating Borg for over 15 years.
Borg was used by Google internally to manage its systems.
For more information here is the full paper https://research.google/pubs/pub43438/
What is Kubernetes?
Kubernetes is an open-source container Orchestration Framework.
At its root, it manages containers — to manage applications that are made of of containers- physical machines, virtual machines, hybrid environments
According to the kubernetes.io website, Kubernetes is:
"an open-source system for automating deployment, scaling, and management of containerized applications".
What problems does it solve
- Following the trend from Monolithic to Microservices — traditionally, an application would be a Monolithic application — which requires the hardware to scale with the application. In comparison, Kubernetes deploys a large number of small web servers.
- Containers are the perfect host for small self-contained applications
- Applications comprised of 100s of containers — managing those with scripts can be really difficult and even impossible
- Kubernetes helps us with the following: connecting containers across multiple hosts, scaling them, deploying applications without downtime, and service discovery among several other aspects
The benefits of splitting up your application from Monolithic into Microservices is that they are easier to maintain. For instance:
Instead of a large Apache web server with many httpd daemons responding to page requests, there would be many nginx servers, each responding.
Additionally, it allows us to separate matters of concerns within our application i.e. decoupling the architecture based on responsibilies.
Additionally, Kubernetes is an essential part of
- Continuous Integration
- Continuous Delivery
Orchestration tools such as Kubernetes offer:
- High availability
- Scalability: Applications have higher performance e.g. load time
- Disaster Recovery: The architecture has to have a way to back-up the data and restore the state of the application at any point in time
How does the architecture actually look like:
- You have a master node: Runs several Kubernetes processes that are necessary to run the container's processes — e.g. an API server ⇒ the entry point to the Kubernetes cluster (UI, API, CLI); then it needs to have a Controller Manager ⇒ keeps track of what is happening e.g. detects when a pod dies ⇒ detects state changes; and lastly, it contains a Scheduler ⇒ this ensures the Pod placement (more on pods later); etcd database ⇒ key-value storage that holds the state of the Kubernetes cluster at any point in time; and the last thing that is needed is the Virtual Network that spans across all the nodes in the cluster
- And worker nodes: contains Containers of different applications; here is where the actual work is happening
Note that worker nodes are usually much bigger because they are running the containers. The master node will only run a selection of processes. Note now master node is named as control plane.
Each node will have multiple pods with containers running on them. 3 processes have to be present on all nodes
- Container Runtime e.g. Docker
- Kubelet; which is a process of Kubernetes itself that interacts with both, the container runtime and the node — it is responsible for taking our configuration and starting a pod inside the node
Usually a Kubernetes cluster has several nodes running in parallel.
- nodes communicate with services between each other. Thus, the third process that has to be installed on every node is Kube Proxy that forwards requests between nodes and pods— the communication works in a performant way with low overhead. Requests are forwarded to the closest pod.
Kubernetes Concepts — Pods
Pod ⇒ the smallest unit that you, as a Kubernetes user will configure
- Pods are a wrapper of a container; on each worker node, we will have multiple containers
- Usually, you would have one application, one container per pod
- Each Pod has its own IP address — thus, each pod is its own self-containing server. This allows pods to communicate with each other — through their internal IP addresses
Note that we don't actually create containers inside the Kubernetes cluster but we work with the pods that are an abstraction layer over the containers. Pods manage the containers without our intervention
In case a pod dies, it can be configured to recreate (as per restart policy) and it will get a new IP address.
A service is used as an alternative for a pods IP address. Resulting, there is a service that sits in front of each pod that abstracts away the dynamic IP address. Resulting, the lifecycle of a pod and the IP address are not tied to each other-
If a pod behind the service dies, it gets recreated.
A service has two main functions:
- Providing an IP address to the pod(s)
- It is a Loadbalancer (what the hack is that 😆 — more on this later)
How do we create those components
- All configuration goes through the master node — UI, API, CLI, all talk to the API server within the master node — they send the configuration request to the API server
- The configuration is usually in YAML format ⇒ a blue print for creating pods. The Kubernetes agents convert the YAML to JSON prior to persistence to the database.
- The configuration of the requirements are in a declarative format. This will allow it to compare the desired state to the actual state (more on this later)
Developer Workflow:
- Create Docker images based on your application
- Use Docker and Kubernetes
- A CI pipeline to build, test, and verify Docker images
- "You must be able to perform rolling updates and rollbacks, and eventually tear down the resource when no longer needed." — the course
This requires flexible and easy to use network storage.
Kubernetes Architecture
100Days Resources
- Video by Anais Urlichs
- Add your blog posts, videos etc. related to the topic here!
Learning Resources
Example Notes
We can divide the responsibilities within a Kubernetes cluster between a main node and worker nodes. Note that in small clusters we may have one node that takes the responsibilities of both.
Main Node
Where does the orchestration from Kubernetes come in? These are some characteristics that make up Kubernetes as a container orchestration system:
- Managed by several operators and controllers — will look at operators and controllers later on. Operators make use of custom resources to manage an application and their components.
- "Each controller interrogates the kube-apiserver for a particular object state, modifying the object until the declared state matches the current state." In short, controllers are used to ensure a process is happening in the desired way.
- "The ReplicaSet is a controller which deploys and restarts containers, Docker by default, until the requested number of containers is running." In short, its purpose is to ensure a specific number of pods are running.
Note that those concepts are details in further sections of the book.
There are several other API objects which can be used to deploy pods. A DaemonSet will ensure that a single pod is deployed on every node. These are often used for logging and metrics. A StatefulSet can be used to deploy pods in a particular order, such that following pods are only deployed if previous pods report a ready status.
API objects can be used to know
-
What containerized applications are running (and on which nodes)
-
The resources available to those applications
-
The policies around how those applications behave, such as restart policies, upgrades, and fault-tolerance
-
kube-apiserver
- Provides the front-end to the cluster's shared state through which all components interact
- Is central to the operation of the Kubernetes cluster.
- Handles internal and external traffic
- The only agent that connects to the etcd database
- Acts as the master process for the entire cluster
- Provides the out-wards facing state for the cluster's state
- Each API call goes through three steps: authentication, authorization, and several admission controllers.
-
kube-scheduler
- The Scheduler sees a request for running a container and will run the container in the best suited node
- When a new pod has to be deployed, the kube-scheduler determines through an algorithm to which node the pod should be deployed
- If the pod fails to be deployed, the kube-scheduler will try again based on the resources available across nodes
- A user could also determine which node the pod should be deployed to —this can be done through a custom scheduler
- Nodes that meet scheduling requirements are called feasible nodes.
- You can find more details about the scheduler on GitHub.
-
etcd Database
- The state of the cluster, networking, and other persistent information is kept in an etcd database
- etcd is a consistent and highly-available key value store used as Kubernetes' backing store for all cluster data
- Note that this database does not change; previous entries are not modified and new values are appended at the end.
- Once an entry can be deleted, it will be labelled for future removal by a compaction process. It works with curl and other HTTP libraries and provides reliable watch queries.
- Requests to update the database are all sent through the kube api-server; each request has its own version number which allows the etcd to distinguish between requests. If two requests are sent simultaneously, the second request would then be flagged as invalid with a 409 error and the etcd will only update as per instructed by the first request.
- Note that it has to be specifically configured
-
Other Agents
- The kube-controller-manager is a core control loop daemon which interacts with the kube-apiserver to determine the state of the cluster. If the state does not match, the manager will contact the necessary controller to match the desired state. It is also responsible to interact with third-party cluster management and reporting.
- The cluster has several controllers in use, such as endpoints, namespace, and replication. The full list has expanded as Kubernetes has matured. Remaining in beta as of v1.16, the cloud-controller-manager interacts with agents outside of the cloud. It handles tasks once handled by kube-controller-manager. This allows faster changes without altering the core Kubernetes control process. Each kubelet must use the --cloud-provider-external settings passed to the binary.
-
There are several add-ons which have become essential to a typical production cluster, such as DNS services. Others are third-party solutions where Kubernetes has not yet developed a local component, such as cluster-level logging and resource monitoring.
"Each node in the cluster runs two processes: a kubelet and a kube-proxy."
Kubelet: handles requests to the containers, manages resources and looks after the local nodes
The Kube-proxy creates and manages networking rules — to expose container on the network
-
kubelet
Each node has a container runtime e.g. the Docker engine installed. The kubelet is used to interact with the Docker Engine and to ensure that the containers that need to run are actually running.
Additionally, it does a lot of the work for the worker nodes; such as accepting API calls for the Pods specifications that are either provided in JSON or YAML.
Once the specifications are received, it will take care of configuring the nodes until the specifications have been met
Should a Pod require access to storage, Secrets or ConfigMaps, the kubelet will ensure access or creation. It also sends back status to the kube-apiserver for eventual persistence.
-
kube-proxy
The kube-proxy is responsible for managing the network connectivity to containers. To do that is has iptables.
"iptables is a user-space utility program that allows a system administrator to configure the IP packet filter rules of the Linux kernel firewall, implemented as different Netfilter modules."
Additional options are the use of namespaces to monitor services and endpoints, or ipvs to replace the use of iptables
To easily manage thousands of Pods across hundreds of nodes can be a difficult task to manage. To make management easier, we can use labels, arbitrary strings which become part of the object metadata. These can then be used when checking or changing the state of objects without having to know individual names or UIDs. Nodes can have taints to discourage Pod assignments, unless the Pod has a toleration in its metadata.
Multi-tenancy
When multiple-users are able to access the same cluster
Additional security measures can be taken through either of the following:
-
Namespaces: Namespaces can be used to "divide the cluster"; additional permissions can be set on each namespace; note that two objects cannot have the same name in the same namespace
-
Context: A combination of user, cluster name and namespace; this allows you to restrict the cluster between permissions and restrictions. This information is referenced by ~/.kube/config
Can be checked with
kubectl config view -
Resource Limits: Provide a way to limit the resources that are provided for a specific pod
-
Pod Security Policies: "A policy to limit the ability of pods to elevate permissions or modify the node upon which they are scheduled. This wide-ranging limitation may prevent a pod from operating properly. The use of PSPs may be replaced by Open Policy Agent in the future."
-
Network Policies: The ability to have an inside-the-cluster firewall. Ingress and Egress traffic can be limited according to namespaces and labels as well as typical network traffic characteristics.
Kubernetes Pods
100Days Resources
- Video by Anais Urlichs
- Add your blog posts, videos etc. related to the topic here!
Learning Resources
- https://www.vmware.com/topics/glossary/content/kubernetes-pods
- https://cloud.google.com/kubernetes-engine/docs/concepts/pod
- https://kubernetes.io/docs/concepts/workloads/pods/
Example Notes
Overview
Pods are the smallest unit in a Kubernetes cluster; which encompass one or more application ⇒ it represents processes running on a cluster. Pods are used to manage your application instance.
Here is a quick summary of what a Pod is and its responsibilities:
- In our nodes, and within our Kubernetes cluster, the smallest unit that we can work with are pods.
- Containers are part of a larger object, which is the pod. We can have one or multiple containers within a pod.
- Each container within a pod share an IP address, storage and namespace — each container usually has a distinct role inside the pod.
- Note that pods usually operate on a higher level than containers; they are more of an abstraction of the processes within a container than the container itself.
- A pod can also run multiple containers; all containers are started in parallel ⇒ this makes it difficult to know which process started before another.
- Usually, one pod is used per container process; reasons to run two containers within a pod might be logging purposes.
- initContainers can be used to ensure some containers are ready before others in a pod. To support a single process running in a container, you may need logging, a proxy, or special adapter. These tasks are often handled by other containers in the same Pod.
- Usually each pod has one IP address.
- You may find the term sidecar for a container dedicated to performing a helper task, like handling logs and responding to requests, as the primary application container may have this ability.
Running multiple containers in one pod
An example for running multiple containers within a pod would be an app server pod that contains three separate containers: the app server itself, a monitoring adapter, and a logging adapter. Resulting, all containers combines will provide one service.
In this case, the logging and monitoring container should be shared across all projects within the organisation.
Replica sets
Each pod is supposed to run a single instance of an application. If you want to scale your application horizontally, you can create multiple instance of that pod.
It is usually not recommended to create pods manually but instead use multiple instances of the same application; these are then identical pods, called replicas.
Such a set of replicated Pods are created and managed by a controller, such as a Deployment.
Connection
All the pods in a cluster are connected. Pods can communicate through their unique IP address. If there are more containers within one pod, they can communicate over localhost.
Pods are not forever
Pods are not "forever"; instead, they easily die in case of machine failure or have to be terminated for machine maintenance. When a pod fails, Kubernetes automatically (unless specified otherwise) spins it up again.
Additionally, a controller can be used to ensure that the pod is "automatically" healing. In this case, the controlled will monitor the stat of the pod; in case the desired state does not fit the actual state; it will ensure that the actual state is moved back towards the desired state.
It is considered good practice to have one process per pod; this allows for easier analysis and debugging.
Each pod has:
- a unique IP address (which allows them to communicate with each other)
- persistent storage volumes (as required) (more on this later on another day)
- configuration information that determine how a container should run
Pod lifecycle
(copied from Google)
Each Pod has a PodStatus API object, which is represented by a Pod's status field. Pods publish their phase to the status: phase field. The phase of a Pod is a high-level summary of the Pod in its current state.
When you run
kubectl get pod Link
to inspect a Pod running on your cluster, a Pod can be in one of the following
possible phases:
- Pending: Pod has been created and accepted by the cluster, but one or more of its containers are not yet running. This phase includes time spent being scheduled on a node and downloading images.
- Running: Pod has been bound to a node, and all of the containers have been created. At least one container is running, is in the process of starting, or is restarting.
- Succeeded: All containers in the Pod have terminated successfully. Terminated Pods do not restart.
- Failed: All containers in the Pod have terminated, and at least one container has terminated in failure. A container "fails" if it exits with a non-zero status.
- Unknown: The state of the Pod cannot be determined.
Limits
Pods by themselves do not have a memory or CPU limit. However, you can set limits to control the amount of CPU or memory your Pod can use on a node. A limit is the maximum amount of CPU or memory that Kubernetes guarantees to a Pod.
Termination
Once the process of the pod is completed, it will terminate. Alternatively, you can also delete a pod.
Setup your first Kubernetes Cluster
100Days Resources
Learning Resources
- What is Kubernetes: https://youtu.be/VnvRFRk_51k
- Kubernetes architecture explained: https://youtu.be/umXEmn3cMWY
Example Notes
Today, I will get started with the book: The DevOps 2.3 Toolkit; and will work my way through the book.
Chapter 1 provides an introduction to Kubernetes; I will use it to optimise the notes from the previous day.
Chapter 2 provides a walkthrough on how to set-up a local Kubernetes cluster using minikube or microk8s. Alternatively, kind could also be used to create a local Kubernetes cluster or if you have Docker Desktop you could use directly the single node cluster included.
Prerequisites
- Have Docker installed (if not go ahead and do it): https://docs.docker.com/
- Install kubectl
Here is how to install kubectl
If you have the Homebrew package manager installed, you can use that:
brew install kubectl
On Linux, the commands are going to be:
curl -LO [https://storage.googleapis.com/kubernetes-release/release/$](https://storage.googleapis.com/kubernetes-release/release/$)(curl -s https:/\
/storage.googleapis.com/kubernetes-release/release/stable.txt)/bin/linux/amd64/kubec\
tl

chmod +x ./kubectl

sudo mv ./kubectl /usr/local/bin/kubectl
To make sure you have kubectl installed, you can run
kubectl version --output=yaml
Install local cluster
To install minikube, you require a virtualisation technology such as VirtualBox. If you are on windows, you might want to use hyperv instead. Minikube provides a single node instance that you can use in combination with kubectl.
It supports DNS, Dashboards, CNI, NodePorts, Config Maps, etc. It also supports multiple hypervisors, such as Virtualbox, kvm, etc.
In my case I am going to be using microk8s since I had several issues getting started with minikube. However, please don't let this put you off. Please look for yourself into each tool and decide which one you like the best.
Microk8s provides a lightweight Kubernetes installation on your local machine. Overall, it is much easier to install on Linux using snap since it does not require any virtualization tools.
sudo snap install microk8s --classic
However, also the Windows and Mac installation are quite straightforward so have a look at those on their website.
Make sure that kubectl has access directly to your cluster.
If you have multiple clusters configured, you can switch between them using your kubectl commands
To show the different clusters available:
kubectl config get-contexts
to switch to a different cluster:
kubectl config use-context <name of the context>
Once we are connected to the right cluster, we can ask kubectl to show us our nodes
kubectl get nodes
Or you could see the current pods that are running on your cluster — if it is a new cluster, you likely don't have any pods running.
kubectl get pods
In the case of minikube and microk8s, we have only one node
Running Pods
100Days Resources
- Video by Anais Urlichs
- Add your blog posts, videos etc. related to the topic here!
Learning Resources
- How Pods and the Pod Lifecycle work in Kubernetes
- Pods and Containers - Kubernetes Networking | Container Communication inside the Pod
Example Notes
Practical Example
Fork the following repository: https://github.com/vfarcic/k8s-specs
git clone https://github.com/vfarcic/k8s-specs.git

cd k8s-specs
Create a mongo DB database
kubectl run db --image mongo \
--generator "run-pod/v1"
If you want to confirm that the pod was created do: kubectl get pods
Note that if you do not see any output right away that is ok; the mongo image is really big so it might take a while to get the pod up and running.
Confirm that the image is running in the cluster
docker container ls -f ancestor=mongo
To delete the pod run
kubectl delete pod db
Delete the pod above since it was not the best way to run the pod.
- Pods should be created in a declarative format. However, in this case, we created it in an imperative way — BAD!
To look at the pod definition:
cat pod/db.yml
apiVersion: v1 // means the version 1 of the Kubernetes pod API; API version and kind has to be provided -- it is mandatory
kind: Pod
metadata: // the metadata provides information on the pod, it does not specifiy how the pod behaves
name: db
labels:
type: db
vendor: MongoLabs // I assume, who has created the image
spec:
containers:
- name: db
image: mongo:3.3 // image name and tag
command: ["mongod"]
args: ["--rest", "--httpinterface"] // arguments, defined in an array
In the case of controllers, the information provided in the metadata has a practical purpose. However, in this case, it merely provides descriptive information.
All arguments that can be used in pods are defined in https://kubernetes.io/docs/reference/generated/kubernetes-api/v1.17/#pod-v1-core
With the following command, we can create a pod that is defined in the pod.yml file
kubectl create -f pod/db.yml
to view the pods (in json format)
kubectl get pods -o json
We can see that the pod went through several stages (stages detailed in the video on pods)
In the case of microk8s, both master and worker nodes run on the same machine.
To verify that the database is running, we can go ahead an run
kubectl exec -it db sh // this will start a terminal inside the running container
echo 'db.stats()'
exit
Once we do not need a pod anymore, we should delete it
kubectl delete -f pod/db.yml
- Kubernetes will first try to stop a pod gracefully; it will have 30s to shut down.
- After the "grace period" a kill signal is sent
Additional notes
- Pods cannot be split across nodes
- Storage within a pod (volumes) can be accessed by all the containers within a pod
Run multiple containers with in a pod
Most pods should be made of a single container; multiple containers within one pod is not common nor necessarily desirable
Look at
cat pod/go-demo-2.yml
of the closed repository (the one cloned at the beginning of these notes)
The yml defines the use of two containers within one pod
kubectl create -f pod/go-demo-2.yml

kubectl get -f pod/go-demo-2.yml
To only retrieve the names of the containers running in the pod
kubectl get -f pod/go-demo-2.yml \
-o jsonpath="{.spec.containers[*].name}"
Specify the name of the container for which we want to have the logs
kubectl logs go-demo-2 -c db
- livenessProbes are used to check whether a container should be running
Have a look at
cat pod/go-demo-2-health.yml
within the cloned repository.
Create the pod
kubectl create \
-f pod/go-demo-2-health.yml
wait a minute and look at the output
kubectl describe \
-f pod/go-demo-2-health.yml
Kubernetes ReplicaSet
100Days Resources
- Video by Anais Urlichs
- Add your blog posts, videos etc. related to the topic here!
Learning Resources
Example Notes
ReplicaSets
It is usually not recommended to create pods manually but instead use multiple instances of the same application; these are then identical pods, called replicas. You can specify the desired number of replicas within the ReplicaSet.
A ReplicaSet ensures that a certain number of pods are running at any point in time. If there are more pods running than the number specified by the ReplicaSet, the ReplicaSet will kill the pods.
Similarly, if any pod dies and the total number of pods is fewer than the defined number of pods, the ReplicaSet will spin up more pods.
Each pod is supposed to run a single instance of an application. If you want to scale your application horizontally, you can create multiple instances of that pod.
The pod ReplicaSet is used for scaling pods in your Kubernetes cluster.
Such a set of replicated Pods are created and managed by a controller, such as a Deployment.
As long as the primary conditions are met: enough CPU and memory is available in the cluster, the ReplicaSet is self-healing; it provides fault tolerance and high availibility.
It's only purpose is to ensure that the specified number of replicas of a service is running.
All pods are managed through Controllers and Services. They know about the pods that they have to manage through the in-YAML defined Labels within the pods and the selectors within the Controllers/Services. Remember the metadata field from one of the previous days — in the case of ReplicaSets, these labels are used again.
Some Practice
Clone the following repository: https://github.com/vfarcic/k8s-specs and enter into the root folder
cd k8s-specs
Looking at the following example
cat rs/go-demo-2.yml
- The selector is used to specify which pods should be included in the replicaset
- ReplicaSets and Pods are decoupled
- If the pods that match the replicaset, it does not have to do anything
- Similar to how the ReplicaSet would scale pods to match the definition provided in the yaml, it will also terminate pods if there are too many
- the spec.template.spec defines the pod
Next, create the pods
kubectl create -f rs/go-demo-2.yml
We can see further details of your running pods through the kubectl describe command
kubectl describe -f rs/go-demo-2.yml
To list all the pods, and to compare the labels specified in the pods match the ReplicaSet
kubectl get pods --show-labels
You can call the number of replicasets by running
kubectl get replicasets
ReplicaSets are named using the same naming convention as used for pods.
Difference between ReplicaSet and Replication Controller
They both serve the same purpose — the Replication Controller is being deprecated.
Operating ReplicaSets
You can delete a ReplicaSet without deleting the pods that have been created by the replicaset
kubectl delete -f rs/go-demo-2.yml \
--cascade=false
And then the ReplicaSet can be created again
kubectl create -f rs/go-demo-2.yml \
--save-config
the —save-config flag ensures that our configurations are saved, which allows us to do more specific tasks later on.
Kubernetes Deployments
100Days Resources
- Video by Anais Urlichs
- Add your blog posts, videos etc. related to the topic here!
Learning Resources
Example Notes
This little exercise will be based on the following application: https://github.com/anais-codefresh/react-article-display
Then we will create a deployment
apiVersion: apps/v1
kind: Deployment
metadata:
  name: react-application
spec:
  replicas: 2
  selector:
    matchLabels:
      run: react-application
  template:
    metadata:
      labels:
        run: react-application
    spec:
      containers:
      - name: react-application
        image: anaisurlichs/react-article-display:master
        ports:
          - containerPort: 80
        imagePullPolicy: Always
More information on Kubernetes deployments
- A deployment is a Kubernetes object that makes it possible to manage multiple, identical pods
- Using deployments, it is possible to automate the process of creating, modifying and deleting pods — it basically manages the lifecycle of your application
- Whenever a new object is created, Kubernetes will ensure that this object exist
- If you try to set-up pods manually, it can lead to human error. On the other hand, using deployments is a better way to prevent human errors.
- The difference between a deployment and a service is that a deployment ensures that a set of pods keeps running by creating pods and replacing broken prods with the resource defined in the template. In comparison, a service is used to allow a network to access the running pods.
- Deploy a replica set or pod
- Update pods and replica sets
- Rollback to previous deployment versions
- Scale a deployment
- Pause or continue a deployment
Create deployment
kubectl create -f deployment.yaml
Access more information on the deployment
kubectl describe deployment <deployment name>
Create the service yml
apiVersion: v1
kind: Service
metadata:
  name: react-application
  labels:
    run: react-application
spec:
  type: NodePort
  ports:
  - port: 8080
    targetPort: 80
    protocol: TCP
    name: http
  selector:
    run: react-application
Creating the service with kubectl expose
kubectl expose deployment/my-nginx
This will create a service that is highly similar to our in yaml defined service. However, if we want to create the service based on our yaml instead, we can run:
kubectl create -f my-pod-service.yml
How is the Service and the Deployment linked?
The targetPort in the service yaml links to the container port in the deployment. Thus, both have to be, for example, 80.
We can then create the deployment and service based on the yaml, when you look for "kubectl get service", you will see the created service including the Cluster-IP. Take that cluster IP and the port that you have defined in the service e.g. 10.152.183.79:8080 basically
kubectl get service

Alternatively, for more information of the service
kubectl get svc <service name> -o yaml
-o yaml: the data should be displayed in yaml format
Delete the resources by
kubectl delete service react-application
kubectl delete deployment react-application

// in this case, your pods are still running, so you would have to remove them individually
Note: replace react-application with the name of your service.
Namespaces
100Days Resources
- Video by Anais Urlichs
- Add your blog posts, videos etc. related to the topic here!
Learning Resources
Example Notes
In some cases, you want to divide your resources, provide different access rights to those resources and more. This is largely driven by the fear that something could happen to your precious production resources.
However, with every new cluster, the management complexity will scale — the more clusters you have, the more you have to manage — basically, the resource overhead of many small clusters is higher than of one big one. Think about this in terms of houses, if you have one big house, you have to take care of a lot but having several small houses, you have x the number of everything + they will be affected by different conditions.
Practical
Let's get moving, you only learn by doing.
Clone this repository https://github.com/vfarcic/k8s-specs
cd k8s-specs
and then, we will use this application
cat ns/go-demo-2.yml
Then we do a nasty work-around to specify the image tag used in the pod
IMG=vfarcic/go-demo-2

TAG=1.0

cat ns/go-demo-2.yml \
| sed -e \
"s@image: $IMG@image: $IMG:$TAG@g" \
| kubectl create -f -
When the -f argument is followed with a dash (-), kubectl uses standard input (stdin) instead of a file.
To confirm that the deployment was successful
kubectl rollout status \
2 deploy go-demo-2-api
Which will get us the following output
hello, release 1.0!
Almost every service are Kubernetes Objects.
kubectl get all
Gives us a full list of all the resources that we currently have up and running.
The system-level objects within our cluster are usually not visible, only the objects that we created.
Within the same namespace, we cannot have twice the same object with exactly the same name. However, we can have the same object in two different namespaces.
Additionally, you could specify within a cluster permissions, quotas, policies, and more — will look at those sometimes later within the challenge.
We can list all of our namespaces through
kubectl get ns
Create a new namespaces
kubectl create namespace testing
Note that you could also use 'ns' for 'namespace'
Kubernetes puts all the resources needed to execute Kubernetes commands into the kube-system namespace
kubectl --namespace kube-system get all
Now that we have a namespace testing, we can use it for new deployments — however, specifying the namespace with each command is annoying. What we can do instead is
kubectl config set-context testing \
 --namespace testing \
 --cluster docker-desktop \
 --user docker-desktop
In this case, you will have to change the command according to your cluster. The created context uses the same cluster as before — just a different namespace.
You can view the config with the following command
kubectl config view
Once we have a new context, we can switch to that one
kubectl config use-context testing
Once done, all of our commands will be automatically executed in the testing namespace.
Now we can deploy the same resource as before but specify a different tag.
TAG=2.0

DOM=go-demo-2.com

cat ns/go-demo-2.yml \
| sed -e \
"s@image: $IMG@image: $IMG:$TAG@g" \
| sed -e \
"s@host: $DOM@host: $TAG\.$DOM@g" \
| kubectl create -f -
to confirm that the rollout has finished
kubectl rollout status \
deployment go-demo-2-api
Now we can send requests to the different namespaces
curl -H "Host: 2.0.go-demo-2.com" \
2 "http://$(minikube ip)/demo/hello"
Deleting resources
It can be really annoying to have to delete all objects one by one. What we can do instead is to delete all resources within a namespace all at once
kubectl delete ns testing
The real magic of namespaces is when we combine those with authorization logic, which we are going to be looking at in later videos.
ConfigMaps
100Days Resources
- Video by Anais Urlichs
- Add your blog posts, videos etc. related to the topic here!
Learning Resources
- https://matthewpalmer.net/kubernetes-app-developer/articles/ultimate-configmap-guide-kubernetes.html
Example Notes
ConfigMaps make it possible to keep configurations separately from our application images by injecting configurations into your container. The content/injection might be configuration files or variables.
It is a type of Volume.
ConfigMaps=Mount a source to a container
It is a directory or file of configuration settings.
Environment variables can be used to configure new applications. They are great unless our application is too complex.
If the application configuration is based on a file, it is best to make the file part of our Docker image.
Additionally, you want to use ConfigMap with caution. If you do not have any variations between configurations of your app, you do not need a ConfigMap. ConfigMaps let you easily fall into the trap of making specific configuration — which makes it harder to move the application and to automate its set-up. Resulting, if you do use ConfigMaps, you would likely have one for each environment.
So what could you store within a ConfigMap
A ConfigMap stores configuration settings for your code. Store connection strings, public credentials, hostnames, and URLs in your ConfigMap.
So make sure to not store any sensitive information within ConfigMap.
We first create a ConfigMap with
kubectl create cm my-config \
--from-file=cm/prometheus-conf.yml
Taking a look into that resource
**kubectl describe cm my-config**
ConfigMap is another volume that, like other volumes, need to mount
cat cm/alpine.yml
The volume mount section is the same, no matter the type of volume that we want to mount.
We can create a pod and make sure it is running
kubectl create -f cm/alpine.yml

kubectl get pods
And then have a look inside the pod
kubectl exec -it alpine -- \
ls /etc/config
You will then see a single file that is correlated to the file that we stored in the ConfigMap
To make sure the content of both files is indeed the same, you can use the following command
kubectl exec -it alpine -- \
cat /etc/config/prometheus-conf.yml
The —from-file argument in the command at the beginning can be used with files as well as directories.
In case we want to create a ConfigMap with a directory
kubectl create cm my-config \
--from-file=cm
and have a look inside
kubectl describe cm my-config
The create a pod that mounts to the ConfigMap
kubectl create -f cm/alpine.yml

kubectl exec -it alpine -- \
ls /etc/config
Make sure to delete all the files within your cluster afterwards
kubectl delete -f cm/alpine.yml

kubectl delete cm my-config
Furthermore, like every other Kubernetes resource, you can define ConfigMaps through Kubernetes YAML files. This actually (probably the easiest way) — write the ConfigMap in YAML and mount it as a Volume
We can show one of our existing ConfigMaps in YAML
kubectl get cm my-config -o yaml
Additionally we can take a look at this file within our repository that has both a Deployment object and a ConfigMap
cat cm/prometheus.yml
kind: ConfigMap
apiVersion: v1
metadata:
  name: example-configmap
data:
  # Configuration values can be set as key-value properties
  database: mongodb
  database_uri: mongodb://localhost:27017

  # Or set as complete file contents (even JSON!)
  keys: |
    image.public.key=771
    rsa.public.key=42
And then create the ConfigMap like any other resource
kubectl apply -f config-map.yaml
kind: Pod
apiVersion: v1
metadata:
  name: pod-using-configmap

spec:
  # Add the ConfigMap as a volume to the Pod
  volumes:
    # `name` here must match the name
    # specified in the volume mount
    - name: example-configmap-volume
      # Populate the volume with config map data
      configMap:
        # `name` here must match the name
        # specified in the ConfigMap's YAML
        name: example-configmap

  containers:
    - name: container-configmap
      image: nginx:1.7.9
      # Mount the volume that contains the configuration data
      # into your container filesystem
      volumeMounts:
        # `name` here must match the name
        # from the volumes section of this pod
        - name: example-configmap-volume
           mountPath: /etc/config
Kubernetes Service
100Days Resources
Learning Resources
- Official Documentation
- https://kubernetes.io/docs/reference/kubectl/cheatsheet/
- https://katacoda.com/courses/kubernetes
- Guides and interactive tutorial within the Kubernetes docs https://kubernetes.io/docs/tutorials/kubernetes-basics/expose/expose-intro/
- Kubernetes by example https://kubernetesbyexample.com/ created by OpenShift
Example Notes
Pods are formed, destroyed and never repaired. You would not repair an existing, running pod but rather deploy a new, healthy one.
Controllers, along with the Scheduler inside your Kubernetes cluster are making sure that pods are behaving correctly, they are monitoring the pods.
So far, only containers within the same pod can talk to each other through localhost. This prevents us from scaling our application. Thus we want to enable communication between pods. This is done with Kubernetes Services.
Kubernetes Services provide addresses through which associated Pods can be accessed.
A service is usually created on top of an existing deployment.
Follow along
Clone the following repository: https://github.com/vfarcic/k8s-specs
And prepare our minikube, microk8s or whatever you are using as your local cluster 🙂
cd k8s-specs

git pull

minikube start --vm-driver=virtualbox

kubectl config current-context
For this exercise, we are going to create the following ReplicaSet, similar to what we have done in the previous video. The definition will look as follows:
cat svc/go-demo-2-rs.yml
Now create the ReplicaSet:
kubectl create -f svc/go-demo-2-rs.yml

// get the state of it
kubectl get -f svc/go-demo-2-rs.yml
Before continuing with the next exercises, make sure that both replicas are ready
With the kubectl expose command, we can tell Kubernetes that we want to expose a resource as service in our cluster
kubectl expose rs go-demo-2 \
 --name=go-demo-2-svc \
 --target-port=28017 \ // this is the port that the MongoDB interface is listening to
 --type=NodePort
We can have by default three different types of Services
ClusterIP
ClusterIP is used by default. It exposes the service only within the cluster. By default you want to be using ClusterIP since that prevents any external communication and makes your cluster more secure.
NodePort
Allows the outside world to access the node IP
and LoadBalancer
The LoadBalancer is only useful when it is combined with the LoadBalancer of your cloud provider.
The process when creating a new Service is something like this:
- First, we tell our API server within the master node in our cluster it should create a new service — in our case, this is done through kubectl commands.
- Within our cluster, inside the master node, we have an endpoint controller. This controller will watch our API server to see whether we want to create a new Service. Once it knows that we want to create a new service, it will create an endpoint object.
- The kube-proxy watches the cluster for services and enpoints that it can use to configure the access to our cluster. It will then make a new entry in its iptable that takes note of the new information.
- The Kube-DNS realises that there is a new service and will add the db’s record to the dns server (skydns).
Taking a look at our newly created service:
kubectl describe svc go-demo-2-svc
- All the pods in the cluster can access the targetPort
- The NodePort automatically creates the clusterIP
- Note that if you have multiple ports defined within a service, you have to name those ports
Let’s see whether the Service indeed works.
PORT=$(kubectl get svc go-demo-2-svc
-o jsonpath="{.spec.ports[0].nodePort}")
IP=$(minikube ip)
open "http://$IP:$PORT"
Creating Services in a Declarative format
cat svc/go-demo-2-svc.yml
- The service is of type NodePort - making it available within the cluster
- TCP is used as default protocol
- The selector is used by the service to know which pods should receive requests (this works the same way as the selector within the ReplicaSet)
With the following command, we create the service and then get the sevrice
kubectl create -f svc/go-demo-2-svc.yml

kubectl get -f svc/go-demo-2-svc.yml
We can look at our endpoint through
kubectl get ep go-demo-2 -o yaml
- The subset responds to two pods, each pod has its own IP address
- Requests are distributed between these two nodes
Make sure to delete the Service and ReplicaSet at the end
kubectl delete -f svc/go-demo-2-svc.yml

kubectl delete -f svc/go-demo-2-rs.yml
Ingress
100Days Resources
- Video by Anais Urlichs
- Add your blog posts, videos etc. related to the topic here!
Learning Resources
Example Notes
Ingress is responsible for managing the external access to our cluster. Whereby it manages
- forwarding rules based on paths and domains
- SSl termination
- and several other features.
The API provided by Ingress allows us to replace an external proxy with a loadbalancer.
Things we want to resolve using Ingress
- Not having to use a fixed port — if we have to manage multiple clusters, we would have a hard time managing all those ports
- We need standard HTTPS(443) or HTTP (80) ports through a predefined path
When we open an application, the request to the application is first received by the service and LoadBalancer, which is the responsible for forwarding the request to either of the pods it is responsible for.
To make our application more secure, we need a place to store the application's HTTPS certificate and forwarding. Once this is implemented, we have a mechanism that accepts requests on specific ports and forwards them to our Kubernetes Service.
The Ingress Controller can be used for this.
Unlike other Kubernetes Controllers, it is not part of our cluster by default but we have to install it separately.
If you are using minikube, you can check the available addons through
minikube addons list
And enable ingress (in case it is not enabled)
minikube addons enable ingress
If you are on microk8s, you can enable ingress through
microk8s enable ingress
You can check whether it is running through — if the pods are running for nginx-ingress, they will be listed
kubectl get pods --all-namespaces | grep nginx-ingress
If you receive an empty output, you might have to wait a little bit longer for Ingress to start.
Here is the YAML definition of our Ingress resource
apiVersion: networking.k8s.io/v1
kind: Ingress
metadata:
  name: react-application
  annotations:
    kubernetes.io/ingress.class: "nginx"
    ingress.kubernetes.io/ssl-redirect: "false"
    nginx.ingress.kubernetes.io/ssl-redirect: "false"
spec:
  rules:
  - http:
      paths:
      - path: /demo
        pathType: ImplementationSpecific
        backend:
          service:
            name: react-application
            port:
              number: 8080
- The annotation section is used to provide additional information to the Ingress controller.
- The path is the path after the
You can find a list of annotations and the controllers that support them on this page: https://github.com/kubernetes/ingress-nginx/blob/master/docs/user-guide/nginx-configuration/annotations.md
We have to set the ssl redirect to false since we do not have an ssl certificate.
You can create the resource through
kubectl create \
-f <name of your file>
If your application's service is set to NodePort, you will want to change it back into ClusterIP since there is no need anymore for NodePort.
What happens when we create a new Ingress resource?
- kubectl will send a request to the API Server of our cluster requesting the creation of a new Ingress resource
- The ingress controller is consistently checking the cluster to see if there is a new ingress resource
- Once it sees that there is a new ingress resource, it will configure its loadbalancer
Ingress is a kind of service that runs on all nodes within your cluster. As long as requests match any of the rules defined within Ingress, Ingress will forward the request to the respective service.
To view the ingress running inside your cluster, use
kubectl get ing
Note that it might not work properly on microk8s.
Service Mesh
100Days Resources
- Video by Anais Urlichs
- Add your blog posts, videos etc. related to the topic here!
Learning Resources
Example Notes
The goal is:
- Higher Portability: Deploy it wherever
- Higher Agility: Update whenever
- Lower Operational Management: Invest low cognitive
- Lower Security Risk
How do Services find each other?
- Answering this question allows us to break down the value of Service Mesh — different Services have to find each other.
- If one service fails, the traffic has to be routed to another service so that requests don't fail
Service-discovery can become the biggest bottleneck.
Open platform, independent service mesh.
In its simplest form a service mesh is a network of your microservices, managing the traffic between services. This allows it to manage the different interactions between your microservices.
A lot of the responsibilities that a service mesh has could be managed on an application basis. However, with the service mesh takes that logic out of the application specific services and manages those on an infrastructure basis.
Why do you need Service Mesh?
Istio is a popular solution for managing communication between microservices.
When we move from monolithic to microservice application, we run into several issues that we did not have before. It will need the following setup
- Each microservice has its own business logic — all service endpoints must be configured
- Ensure Security standards with firewall rules set-up — every service inside the cluster can talk to every other service if we do not have any additional security inside — for more important applications this is not secure enough. This may result in a lot of complicated configuration.
To better manage the application configuration, everything but the business logic could be packed into its own Sidecar Proxy, which would then be responsible to
- Handle the networking logic
- Act as a Proxy
- Take care of third-party applications
- Allow cluster operators to configure everything easily
- Enable developers to focus on the actual business logic
A service mesh will have a control plane that will inject this business logic automatically into every service. Once done, the microservices can talk to each other through proxies.
Core feature of service mesh: Traffic Splitting:
- When you spin up a new service in response to a high number of requests, you only want to forward about 10% of the traffic to the new Service to make sure that it really works before distributing the traffic between all services. This may also be referred to as Canary Deployment
"In a service mesh, requests are routed between microservices through proxies in their own infrastructure layer. For this reason, individual proxies that make up a service mesh are sometimes called “sidecars,” since they run alongside each service, rather than within them. Taken together, these “sidecar” proxies—decoupled from each service—form a mesh network."
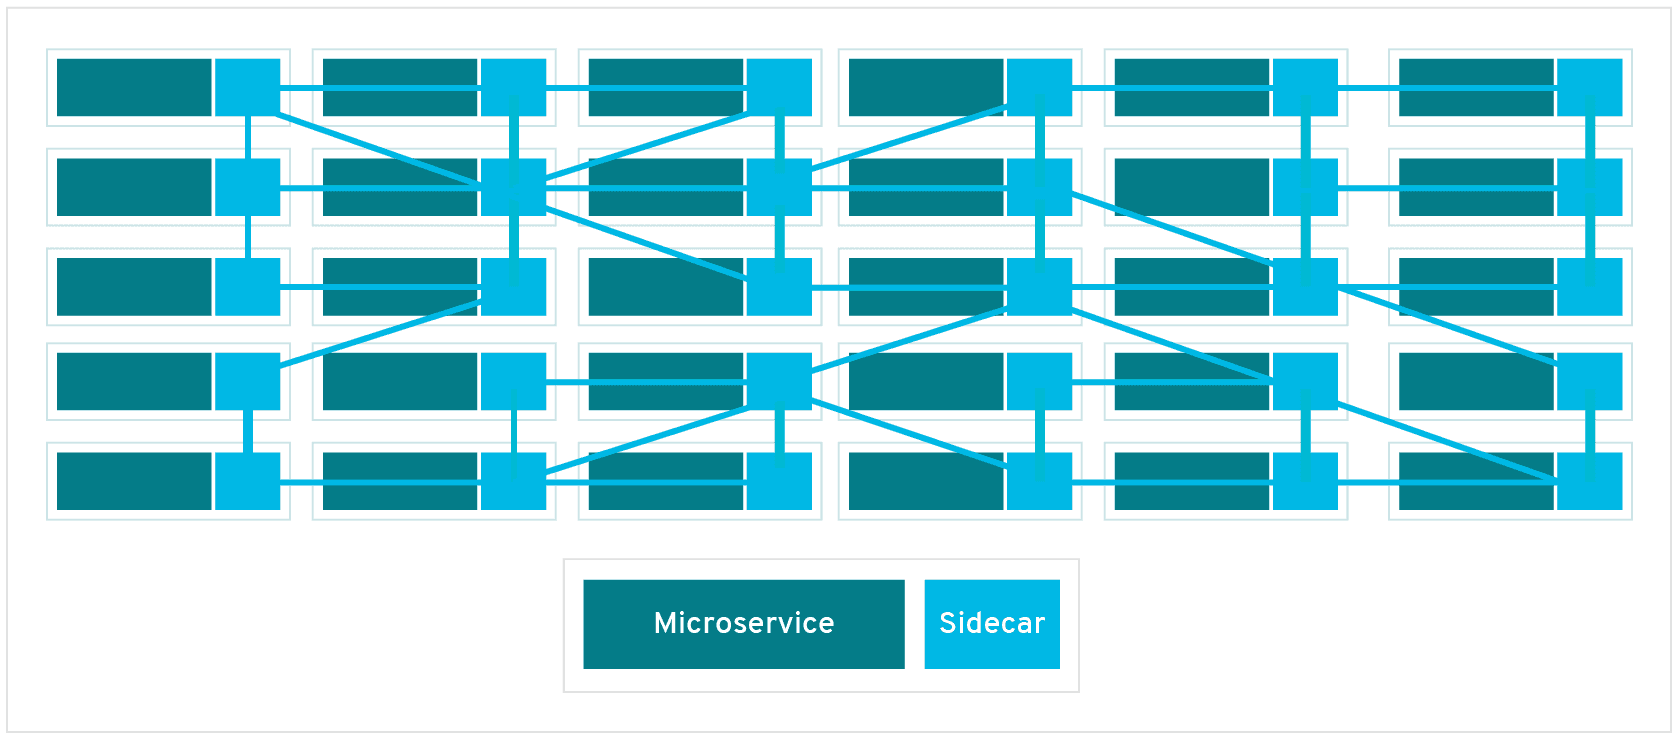
"A sidecar proxy sits alongside a microservice and routes requests to other proxies. Together, these sidecars form a mesh network."
Service Mesh is just a paradigm and Istio is one of the implementations
Istio allows Service A and Service B to communicate to each other. Once your microservices scale, you have more services, the service mesh becomes more complicated — it becomes more complicated to manage the connection between different services. That's where Istio comes in.
It runs on
- Kubernetes
- Nomad
- Console
I will focus on Kubernetes.
Features
- Load Balancing: Receive some assurance of load handling — enabled some level of abstraction that enables services to have their own IP addresses.
- Fine Grain Control: to make sure to have rules, fail-overs, fault connection
- Access Control: Ensure that the policies are correct and enforceable
- Visibility: Logging and graphing
- Security: It manages your TSL certificates
Additionally, Service Mesh makes it easier to discover problems within your microservice architecture that would be impossible to discover without.
Components — Connect to the Control Plane API within Kubernetes — note that this is the logic of Istio up to version 1.5. The latest versions only deal with Istiod.
- Pilot: Has A/B testing, has the intelligence how everything works, the driver of Istio
- Cit: Allows Service A and Service B to talk to each other
How do we configure Istio?
- You do not have to modify any Kubernetes Deployment and Service YAML files
- Istio is configured separately from application configuration
- Since Istio is implemented through Kubernetes Custom Resource Definitions (CRD), it can be easily extended with other Kubernetes-based plug-ins
- It can be used like any other Kubernetes object
The Istio-Ingress Gateway is an entry-point to our Kubernetes cluster. It runs as a pod in our cluster and acts as a LoadBalancer.
Service Mesh Interface
With different projects and companies creating their own Service Mesh, the need for standards and specifications arise. One of those standards is provided by the Service Mesh Interface (SMI). In its most basic form, SMI provides a list of Service Mesh APIs. Separately SMI is currently a CNCF sandbox project.
SMI provides a standard interface for Service Mesh on Kubernetes
- Provides a basic set of features for the most common use cases
- Flexible to support new use case over time
Website with more information
SMI covers the following
- Traffic policy – apply policies like identity and transport encryption across services
- Traffic telemetry – capture key metrics like error rate and latency between services
- Traffic management – shift traffic between different services
Other Service Mesh Examples
- Gloo Mesh: Enterprise version of Istio Service Mesh but also has a Gloo Mesh open source version.
- Linkerd: Its main advantage is that it is lighter than Istio itself. Note that Linkerd was origially developed by Buoyant. Linkerd specifically, is run through an open governance model.
- Nginx service mesh: Focused on the data plane and security policies; platform agnostic; traffic orchestration and management
Kubernetes Volumes
100Days Resources
- Video by Anais Urlichs
- Add your blog posts, videos etc. related to the topic here!
Learning Resources
- https://kubernetes.io/docs/tasks/configure-pod-container/configure-volume-storage/
- https://codeburst.io/kubernetes-storage-by-example-part-1-27f44ae8fb8b
- https://youtu.be/0swOh5C3OVM
Example Notes
We cannot store data within our containers — if our pod crashes and restarts another container based on that container image, all of our state will be lost. Kubernetes does not give you data-persistence out of the box.
Volumes are references to files and directories made accessible to containers that form a pod. So, they basically keep track of the state of your application and if one pod dies the next pod will have access to the Volume and thus, the previously recorded state.
There are over 25 different Volume types within Kubernetes — some of which are specific to hosting providers e.g. AWS
The difference between volumes is the way that files and directories are created.
Additionally, Volumes can also be used to access other Kubernetes resources such as to access the Docker socket.
The problem is that the storage has to be available across all nodes. When a pod fails and is restarted, it might be started on a different node.
Overall, Kubernetes Volumes have to be highly error-resistant — and even survive a crash of the entire cluster.
Volumes and Persistent Volumes are created like other Kubernetes resources, through YAML files.
Additionally, we can differentiate between remote and local volumes — each volume type has its own use case.
Local volumes are tied to a specific node and do not survive cluster disasters. Thus, you want to use remote volumes whenever possible.
apiVersion: v1
kind: Pod
metadata:
  name: empty-dir
spec:
  containers:
    - name: busybox-a
      command: ['tail', '-f', '/dev/null']
      image: busybox
      volumeMounts:
        - name: cache
          mountPath: /cache
    - name: busybox-b
      command: ['tail', '-f', '/dev/null']
      image: busybox
      volumeMounts:
        - name: cache
          mountPath: /cache
  volumes:
    - name: cache
      emptyDir: {}
Create the resource:
kubectl apply -f empty-dir
Write to the file:
kubectl exec empty-dir --container busybox-a -- sh -c "echo \"Hello World\" > /cache/hello.txt"
Read what is within the file
kubectl exec empty-dir --container busybox-b -- cat /cache/hello.txt
However, to ensure that the data will be saved beyond the creation and deletion of pods, we need Persistent volumes. Ephemeral volume types only have the lifetime of a pod — thus, they are not of much use if the pod crashes.
A persistent volume will have to take the same storage as the physical storage.
Storage in Kubernetes is an external plug-in to our cluster. This way, you can also have multiple different storage resources.
The storage resources is defined within the PersistentVolume YAML
A hostPath volume mounts a file or directory from the host node’s filesystem into your Pod. This is not something that most Pods will need, but it offers a powerful escape hatch for some applications.
— Kubernetes — Volumes
apiVersion: v1
kind: Pod
metadata:
  name: host-path
spec:
  containers:
    - name: busybox
      command: ['tail', '-f', '/dev/null']
      image: busybox
      volumeMounts:
        - name: data
          mountPath: /data
  volumes:
  - name: data
    hostPath:
      path: /data
Create the volume
kubectl apply -f empty-dir
Read from the volume
kubectl exec host-path -- cat /data/hello.txt
KinD
100Days Resources
- Video by Anais Urlichs
- Add your blog posts, videos etc. related to the topic here!
Learning Resources
Example Notes
Setting up Kind on Windows and Cluster Comparison
These are the docs that I used to set-up all of my resources on Windows:
Setting up the Ubuntu in Windows
- https://docs.microsoft.com/en-us/windows/wsl/install-win10#step-4---download-the-linux-kernel-update-package
- https://github.com/microsoft/WSL/issues/4766
Use WSL in Code
- https://docs.docker.com/docker-for-windows/wsl/
- https://marketplace.visualstudio.com/items?itemName=ms-vscode-remote.remote-wsl
Kubectl installation
Create Kind cluster
If you want to run microk8s on WSL, you have to get a snap workaround described here
Running a local cluster
Especially when you are just getting started, you might want to spin up a local cluster on your machine. This will allow you to run tests, play around with the resources and more without having to worry much about messing something up :) — If you watched any of my previous videos, you will have already a good understand of how much I enjoy trying out different things — setting things up just to try something out — gain a better understanding — and then to delete everything in the next moment.
Also, you might have seen that I already have two videos on microk8s —mainly since the minikube set-up on my Ubuntu did not properly work. Now that I am on Windows, I might actually have more options. So let's take a look at those and see how they compare.
Kubernetes in Docker
When you install Docker for Desktop (or however you call it) you can enable Kubernetes:
The set-up will take a few seconds but then you have access to a local cluster both from the normal Windows terminal (I am still new to Windows, so excuse any terminology that is off) or through the WSL.
kubectl config get-contexts
and you will see a display of the different clusters that you have set-up. This will allow you to switch to a different cluster:
kubectl config use-context <context name>
Below are several other options highlighted.
minikube
minikube is probably the best known of the three; maybe because it is the oldest. When you are using minikube, it will spin up a VM that runs a single Kubernetes node. To do so it needs hypervisor. Now, if you have never interacted with much virtualisation technology, you might think of a hypervisor as something like this:
I assure you, it is not. So what is a Hypervisor then? A Hypervisor is basically a form of software, firmware, or hardware that is used to set-up virtual environments on your machine.
Running minikube, you can spin up multiple nodes as well, each will be running their own VM (Virtual Machine).
For those of you, who are really into Dashboards, minikube provides a Dashboard, too! Personally, I am not too much of a fan but that is your choice. If you would like some sort of Dashboard, I highly recommend you k9s. Here is my introductory video if you are curious.
This is what the minikube Dashboard looks like — just your usual UI 😊
Now how easy is the installation of minikube? Yes, I mentioned that I had some problems installing minikube on Ubuntu and thus, went with microk8s. At that time, I did not know about kind yet. Going back to the original question, if you are using straight up Windows it is quite easy to install, if you are using Linux in Windows however, it might be a bit different — tbh I am a really impatient person, so don't ask me.
What is kind?
Kind is quite different to minikube, instead of running the nodes in VMs, it will run nodes as Docker containers. Because of that, it is supposed to start-up faster — I am not sure how to test this, they are both spinning up the cluster in an instance and that is good enough for me.
However, note that kind requires more space on your machine to run than etiher microk8s or minikube. In fact, microk8s is actually the smallest of the three.
Like detailed in this article, you can
- With 'kind load docker-image my-app:latest' the image is available for use in your cluster
Which is an additional feature.
If you decide to use kind, you will get the most out of it if you are fairly comfortable to use YAML syntax since that will allow you to define different cluster types.
The documentation that I used to install it
microk8s
Microk8s is in particular useful if you want to run a cluster on small devices; it is better tested in ubuntu than the other tools. Resulting, you can install it with snap super quickly! In this case, it will basically run the cluster separate from the rest of the stuff on your computer.
It also allows for multi-node clusters, however, I did not try that yet, so I don't know how well that actually works.
Also note that if you are using microk8s on MacOS or Windows, you will need a hypevisor of sorts. Running it on Ubuntu, you do not.
My video
Direct comparison
This article by Max Brenner offers a really nice comparison between the different tools with a comparison table https://brennerm.github.io/posts/minikube-vs-kind-vs-k3s.html
K3s and K3sup
100Days Resources
- Video by Anais Urlichs
- Add your blog posts, videos etc. related to the topic here!
Learning Resources
Example Notes
When you are choosing a Kubernetes distribution, the most obvious one is going to be K8s, which is used by major cloud vendors and many more. However, if you just want to play around on your local machine with Kubernetes, test some tools or learn about Kubernetes resources, you would likely go with something like minikube, microk8s or kind.
Now we just highlighted two use cases for different types of Kubernetes clusters. What about use cases where you want to run Kubernetes on really small devices, such as raspberry pis? What about IoT devices? Generally, devices where you want to run containers effectively without consuming too much resources.
In those cases, you could go with K3s.
What is K3s?
In short, k3s is half the size in terms of memory footprint than "normal Kubernetes". The origin of k3s is Rio, which was developed by Rancher. However, they then decided to branch it out of Rio into its own tool — which became K3s. It was more of a figure it out by doing it.
The important aspect of k3s is that it was oriented around production right from the beginning.
You want to be able to run Kubernetes in highly resource constraint environments — which is not always possible with pure Kubernetes.
K3s is currently a CNCF sandbox project — the development is led by Rancher, which provides Kubernetes as a service (?)
- Instead of Docker, it runs Containerd — Note that Kubernetes itself is also moving to Containerd as its container runtime. This does not mean that you will not be able to run Docker containers. If I just scared you, please watch this video to clarify.
Designed based on the following goals:
- Lightweight: Show work on small resource environment
- Compatibility: You should be able to use most of the tools you can use with "normal k8s"
- Ethos: Everything you need to use k3s is built right in
Btw: K3s is described as the second most popular Kubernetes distribution (Read in a Medium post, please don't quote me on this)
How does k3s differ from "normal" Kubernetes?
Do you have questions? We have answers!
Now I recorded last week an episode with Alex Ellis, who built k3sup, which can be used to deploy k3s. Here are some of the questions that I had before the live recording that are answered within the recording itself:
- Let's hear a bit about the background of k3sup — how did it come about?
- How are both pronounced?
- How would you recommend learning about k3s — let's assume you are complete new, where do you start?
- Walking through the k3s architecture https://k3s.io/
- What is the difference between k8s and k3s
- When would I prefer to use k8s over k3s
- What can I NOT do with k3s? Or what would I NOT want to do?
- Do I need a VM to run k3s? It is mentioned in some blog posts — let's assume I do not have a raspberry pi — I have a VM, you can set them up quite easily; why would I run K3s on a VM?
- So we keep discussing that this is great for a Kubernetes homelab or IoT devices — is that not a bit of an overkills to use Kubernetes with it?
- Is the single node k3s similar to microk8s — having one instance that is both worker node
Use cases for k3s:
- Single node clusters
- Edge
- IoT
- CI
- Development Environments and Test Environments
- Experiments, useful for academia
- ARM
- Embedding K8s
- Situations where a PhD in K8s clusterology is infeasible
Install k3s
There are three ways for installing k3s*
- The quick way shown below directly with k3s
- Supposedly easier way with k3s up
- The long way that is detailed over several docs pages https://rancher.com/docs/k3s/latest/en/installation/
*Actually there are several more ways to install k3s like highlighted in this video:
This is the installation script:
curl -sfL https://get.k3s.io | sh -
Note that this might take up to 30 sec. Once done, you should be able to run
k3s kubectl get node
What it does
The K3s service will be configured to automatically restart after node reboots or if the process crashes or is killed Additional utilities will be installed, including kubectl, crictl, ctr, k3s-killall.sh, and k3s-uninstall.sh A kubeconfig file will be written to /etc/rancher/k3s/k3s.yaml and the kubectl installed by K3s will automatically use it
Once this is done, you have to set-up the worker nodes that are used by k3s
curl -sfL https://get.k3s.io | K3S_URL=https://myserver:6443 K3S_TOKEN=mynodetoken sh -
Once installed, access the cluster
Leverage the KUBECONFIG environment variable:
export KUBECONFIG=/etc/rancher/k3s/k3s.yaml
kubectl get pods --all-namespaces
helm ls --all-namespaces
If you do not set KUBECONFIG as an environment variable,
Installing with k3sup
The following is taken from the k3sup README file
$ curl -sLS https://get.k3sup.dev | sh
$ sudo install k3sup /usr/local/bin/
$ k3sup --help
There is a lot to unpack... WHAT DOES THIS SENTENCE MEAN?
This tool uses ssh to install k3s to a remote Linux host. You can also use it to join existing Linux hosts into a k3s cluster as agents.
If you want to get an A to Z overview, watch the following video
If you are still wondering about what k3s, have a look at this video
How is Kubernetes modified?
- This is not a Kubernetes fork
- Added rootless support
- Dropped all third-party storage drivers, completely CSI is supported and preferred
Following this tutorial; note that there are many others that you could use — have a look at their documentation:
https://rancher.com/blog/2020/k3s-high-availability
Kustomize
100Days Resources
- Video by Anais Urlichs
- Add your blog posts, videos etc. related to the topic here!
Learning Resources
- Their webiste has lots of amazing videos
Example Notes
Configuration Management for Kubernetes
— "A template free way to customize application configuration that simplifies the use of off-the-shelf applications"
When I create a YAML, the manifests go into the API server of the main node; the cluster then aims to create the resources within the cluster to match the desired state defined in the YAML
Different to what we have seen before in the videos, YAML can get super complex! Additionally, there are several aspects of the state of our deployment that we want to frequently change. Including:
- Namespaces, Labels, Container Registry, Tags and more
Then, we have resources and processes that we want to change a bit less frequently, such as
- Management Parameters
- Environment-specific processes and resources
- Infrastructure mapping
Kustomize allows you to specify different values of your Kubernetes resources for different situations.
To make your YAML resources more dynamic and to apply variations between environments, you can use Kustomize.
Let's get started using Kustomize
Install Kustomize — just reading about it is not going to help us.
Here is their official documentation
However, their options did not work for the Linux installation, which I also need on WSL — this one worked:
https://weaveworks-gitops.awsworkshop.io/20_weaveworks_prerequisites/15_install_kustomize.html
Kustomize is part of kubectl so it should work without additional installation using 'kubectl -k' to specify that you want to use kustomize.
Next, scrolling through their documentation, they provide some amazing resources with examples on how to use kubectl correctly — but I am looking for kustomize example
Have a look at their guides if you are curious https://kubectl.docs.kubernetes.io/guides/
So with kustomize, we want to have our YAML tempalte and then customize the values provided to that resource manifest. However, each directory that is referenced within kustomized must have its own kustomization.yaml file.
First, let's set-up a deployment and a service, like we did in one of the previous days.
The Deployment:
apiVersion: apps/v1
kind: Deployment
metadata:
  name: react-application
spec:
  replicas: 2
  selector:
    matchLabels:
      run: react-application
  template:
    metadata:
      labels:
        run: react-application
    spec:
      containers:
      - name: react-application
        image: anaisurlichs/react-article-display:master
        ports:
          - containerPort: 80
        imagePullPolicy: Always
	env:
            - name: CUSTOM_ENV_VARIABLE
              value: Value defined by Kustomize ❤️
The service
apiVersion: v1
kind: Service
metadata:
  name: react-application
  labels:
    run: react-application
spec:
  type: NodePort
  ports:
  - port: 8080
    targetPort: 80
    protocol: TCP
    name: http
  selector:
    run: react-application
Now we want to customize that deployment with specific values.
Set-up a file called 'kustomization.yaml'
**resources:
  - deployment.yaml
  - service.yaml**
Within this file, we will specify specific values that we will use within our Deployment resource. From a Kubernetes perspective, this is just another Kuberentes resource.
One thing worth mentioning here is that Kustomize allows us to combine manifests from different repositories.
So once you want to apply the kustomize resources, you can have a look at the changed resources:
kustomize build .
this will give you the changed YAML files with whatever you had defined in your resources.
Now you can forward those resources into another file:
kustomize build . > mydeployment.yaml
Now if you have kubectl running, you could specify the resource that you want to use through :
kubectl create -k .
-k refers here to - -kustomize, you could use that flag instead if you wanted to.
This will create our Deployment and service — basically all of the resources that have been defined in your kustomization.yaml file
kubectl get pods -l <label specifying your resources>
A different kustomization.yaml
Use this within one environment
resources:
- ../../base
namePrefix: dev-
namespace: development
commonLabels:
  environment: development
And this file for the other environment
resources:
- ../../base
namePrefix: prod-
namespace: production
commonLabels:
  environment: production
  sre-team: blue
Create the new file that includes kustomize and the original resources
kustomize build . > mydeployment.yaml
Check-out the video for more 🙂
Resources
For a comprehensive overview: https://www.youtube.com/watch?v=Twtbg6LFnAg&t=137s
And another hands-on walkthrough: https://youtu.be/ASK6p2r-Yrk
A really good blog post on Kustomize: https://blog.scottlowe.org/2019/09/13/an-introduction-to-kustomize/
Terraform
100Days Resources
- Video by Anais Urlichs
- Add your blog posts, videos etc. related to the topic here!
Learning Resources
- https://youtu.be/UleogrJkZn0
- https://youtu.be/HmxkYNv1ksg
- https://youtu.be/l5k1ai_GBDE
- https://learn.hashicorp.com/tutorials/terraform/kubernetes-provider?in=terraform/use-case
- https://registry.terraform.io/providers/hashicorp/kubernetes/latest/docs/guides/getting-started
Example Notes
With Terraform, you have a DevOps first approach. It is an open-source tools, original developed by HashiCorp
It is an infrastructure provisioning tool that allows you to store your infrastructure set-up as code.
Normally, you would have:
- Provisioning the Infrastructure
- Usually has top be done within a specific order
- Deploying the application
It has a strong open community and is pluggable by design — meaning that it is used by vast number of organisations
Allows you to manage your infrastructure as code in a declarative format.
What would be the alternative?
- Pressing buttons in a UI — the problem with this is that it is not repeatable across machines
Especially important in the microservices world! It would otherwise be more time-consuming and error-prone to set-up all the resources needed for every microservice.
What is a declarative approach?
Current state vs. desired state
Define what the end-result should be.
When you are first defining your resources, this is less needed. However, once you are adding or changing resources, this is a lot more important. It does not require you to know how many resources and what resources are currently available but it will just compare what is the current state and what has to happen to create the desired state.
Different stages of using Terraform:
- Terraform file that defines our resources e.g. VM, Kubernetes cluster, VPC
- Plan Phase — Terraform command: Compares the desired state to what currently exists on our cluster if everything looks good:
- Apply Phase: Terraform is using your API token to spin up your resources
When you defined your Terraform resources, you define a provider:
Connects you to a cloud provider/infrastructure provider. A provider can also be used to spin up platforms and manage SAAS offerings
So, beyond IAAS, you can also manage other platforms and resources through Terraform.
You can configure your provider in either of the following ways:
- Use cloud-specific auth plugins (for example,
eks get-token,az get-token,gcloud config) - Use oauth2 token
- Use TLS certificate credentials
- Use
kubeconfigfile by setting both[config_path](https://registry.terraform.io/providers/hashicorp/kubernetes/latest/docs#config_path)and[config_context](https://registry.terraform.io/providers/hashicorp/kubernetes/latest/docs#config_context) - Use username and password (HTTP Basic Authorization)
Let's try out Terraform
- Install Terraform
- Initialise cloud provider
- Run "terraform init"
- Set-up a security group
- Make sure that you set up the file
- Try whether or not it works with "terraform plan" . Here we would expect something to add but not necessarily something to change or to destroy.
- Don't display your credentials openly, you would probably want to use something like Ansible vault or similar to store your credentials, do not store in plain text
- Once we have finished setting up our resources, we want to destroy them "terraform destroy"
tf is the file extension that Terraform uses
Note that you can find all available information on a data source.
Common question: What is the difference between Ansible and Terraform
- They are both used for provisioning the infrastructure
- However, Terraform also has the power to provision the infrastructure
- Ansible is better for configuring the infrastructure and deploying the application
- Both could be used in combination
I am doing this example on my local kind cluster — have a look at one of the previous videos to see how to set-up kind
We are using a mixture of the following tutorials
- https://registry.terraform.io/providers/hashicorp/kubernetes/latest/docs/guides/getting-started
- https://learn.hashicorp.com/tutorials/terraform/kubernetes-provider?in=terraform/use-case
Create your cluster e.g. with kind
kind-config.yaml
kind: Cluster
apiVersion: kind.x-k8s.io/v1alpha4
nodes:
- role: control-plane
  extraPortMappings:
  - containerPort: 30201
    hostPort: 30201
    listenAddress: "0.0.0.0"
Then run
kind create cluster --name terraform-learn --config kind-config.yaml
For our terraform.tfvar file, we need the following information
[host](https://learn.hashicorp.com/tutorials/terraform/kubernetes-provider?in=terraform/use-case#host)corresponds withclusters.cluster.server.[client_certificate](https://learn.hashicorp.com/tutorials/terraform/kubernetes-provider?in=terraform/use-case#client_certificate)corresponds withusers.user.client-certificate.[client_key](https://learn.hashicorp.com/tutorials/terraform/kubernetes-provider?in=terraform/use-case#client_key)corresponds withusers.user.client-key.[cluster_ca_certificate](https://learn.hashicorp.com/tutorials/terraform/kubernetes-provider?in=terraform/use-case#cluster_ca_certificate)corresponds withclusters.cluster.certificate-authority-data.
To get those, run: "kubectl config view --minify --flatten --context=kind-terraform-learn"
# terraform.tfvars

host                   = "https://127.0.0.1:32768"
client_certificate     = "LS0tLS1CRUdJTiB..."
client_key             = "LS0tLS1CRUdJTiB..."
cluster_ca_certificate = "LS0tLS1CRUdJTiB..."
This is our terraform .tf file
terraform {
  required_providers {
    kubernetes = {
      source = "hashicorp/kubernetes"
    }
  }
}

variable "host" {
  type = string
}

variable "client_certificate" {
  type = string
}

variable "client_key" {
  type = string
}

variable "cluster_ca_certificate" {
  type = string
}

provider "kubernetes" {
  host = var.host

  client_certificate     = base64decode(var.client_certificate)
  client_key             = base64decode(var.client_key)
  cluster_ca_certificate = base64decode(var.cluster_ca_certificate)
}

resource "kubernetes_namespace" "test" {
  metadata {
    name = "nginx"
  }
}
resource "kubernetes_deployment" "test" {
  metadata {
    name      = "nginx"
    namespace = kubernetes_namespace.test.metadata.0.name
  }
  spec {
    replicas = 2
    selector {
      match_labels = {
        app = "MyTestApp"
      }
    }
    template {
      metadata {
        labels = {
          app = "MyTestApp"
        }
      }
      spec {
        container {
          image = "nginx"
          name  = "nginx-container"
          port {
            container_port = 80
          }
        }
      }
    }
  }
}
resource "kubernetes_service" "test" {
  metadata {
    name      = "nginx"
    namespace = kubernetes_namespace.test.metadata.0.name
  }
  spec {
    selector = {
      app = kubernetes_deployment.test.spec.0.template.0.metadata.0.labels.app
    }
    type = "NodePort"
    port {
      node_port   = 30201
      port        = 80
      target_port = 80
    }
  }
}
Now we can run
terraform init

terraform plan

terraform apply
Make sure that all your resources are within the right path and it should work.
Crossplane
Links
Highlights and Intro:
Crossplane is an advanced tool for managing infrastructure in the cloud-native ecosystem.
It distinguishes itself from traditional Configuration Management and Infrastructure as Code (IaC) tools. Platforms like Chef, Puppet, and Ansible have become less prevalent, while Terraform and Pulumi, despite their popularity, lack efficient drift detection. This means if a resource is modified outside Terraform, it won't detect the change. Crossplane, on the other hand, excels in detecting drifts and integrates seamlessly with GitOps workflows, allowing infrastructure management directly through kubectl.
Benefits:
- Manages infrastructure in a cloud-native way using kubectl.
- Supports major cloud providers and is continually updated with new ones.
- Allows building custom infrastructure abstractions.
- Based on Custom Resource Definitions (CRD), making it extensible and runnable anywhere.
- Acts as a single source of truth for infrastructure management.
- Enables management of policies through custom APIs, simplifying infrastructure complexity.
- Offers Declarative Infrastructure Configuration: self-healing and accessible via kubectl and YAML.
- Integrates with leading GitOps tools like Flux & ArgoCD.
Install Crossplane using Helm
Crossplane is an extension to the k8s api, therefore we need a cluster (any cluster would do) to install it. This cluster is some time refered to as operations cluster. In this tutorial we are going to use minikube.
minikube start
Once minikube is up and running, we can install cross-plane by running a helm command.
helm repo add \
crossplane-stable https://charts.crossplane.io/stable

helm repo update

helm install crossplane \
crossplane-stable/crossplane \
--namespace crossplane-system \
--create-namespace
Now, Let's see if crossplane is running without any issues.
kubectl get pods -n crossplane-system
Crossplane is extending the kubernetes api. let's checkout the new custom resource definitions and api.
kubectl api-resources  | grep crossplane
kubectl get crds | grep crossplane
Setting up the Hyperscaler (GCP)
Next, we need to enable crossplane access to our Hyperscaler of choice. All we need is a secret in the crossplane-system namespace.
The secret should contain a service account key.json.
Please note that the service account should be granted proper permissions for resoruce adminstration.
export PROJECT_ID="YOUR-PROJECT-ID"
export SA_NAME="YOUR-SA-NAME"

export SA="${SA_NAME}@${PROJECT_ID}.iam.gserviceaccount.com"

gcloud iam service-accounts \
    create $SA_NAME \
    --project $PROJECT_ID

export ROLE=roles/admin

gcloud projects add-iam-policy-binding \
    --role $ROLE $PROJECT_ID \
    --member serviceAccount:$SA

gcloud iam service-accounts keys \
    create creds.json \
    --project $PROJECT_ID \
    --iam-account $SA

kubectl create secret \
generic gcp-secret \
-n crossplane-system \
--from-file=creds=./creds.json
Setting up the GCP storage provider
Next, we install and configure a crossplane provider that specializes in managing storage related services in GCP.
cat <<EOF | kubectl apply -f -
apiVersion: pkg.crossplane.io/v1
kind: Provider
metadata:
  name: provider-gcp-storage
spec:
  package: xpkg.upbound.io/upbound/provider-gcp-storage:v0.35.0
EOF
Let's give it some time until our provider becomes healthy.
kubectl get providers --watch
Next, we need to configure the provider and make it aware of the GCP secret which we created in the previous step .
cat <<EOF | kubectl apply -f -
apiVersion: gcp.upbound.io/v1beta1
kind: ProviderConfig
metadata:
  name: default
spec:
  projectID: $PROJECT_ID
  credentials:
    source: Secret
    secretRef:
      namespace: crossplane-system
      name: gcp-secret
      key: creds
EOF
Creating a Managed Storage Bucket
The provider is ready to listen to our api requests, Let's create a bucket
BUCKET_NAME=my-crossplane-bucket
cat <<EOF | kubectl create -f -
apiVersion: storage.gcp.upbound.io/v1beta1
kind: Bucket
metadata:
  name: $BUCKET_NAME
  labels:
    docs.crossplane.io/example: provider-gcp
spec:
  forProvider:
    location: US
  providerConfigRef:
    name: default
EOF
Drift Detection
If our managed resouces get modified or deleted outside the scope of crossplane, crossplane provider can react to the drift and reconsile the infrastructure to the desired config. Let's try deleting the bucket from the GCP console. Once done, we can watch the managed bucket again:
watch kubectl get buckets
It takes a few minutes unitl the bucket is ready again,
Cleanup
kubectl delete bucket $BUCKET_NAME
minikube stop
minikube delete
Crossplane Compositions
Links
Highlights and Intro:
Crossplane is an advanced tool for managing infrastructure in the cloud-native ecosystem. Just like terraform encourages using modules for bundling related resources, crossplane offers compositions.
Platform engineerscan define their compositions and provide theDevsa simple claim api.Devsclaim their resources and the composition takes care of the rest.
start minikube
minikube start
install crossplane
helm repo add crossplane-stable \
    https://charts.crossplane.io/stable

helm repo update

helm upgrade --install \
    crossplane crossplane-stable/crossplane \
    --namespace crossplane-system \
    --create-namespace \
    --wait
create GCP credentials secret for crossplane
export SA_NAME="YOUR-SA-NAME"

export SA="${SA_NAME}@${PROJECT_ID}.iam.gserviceaccount.com"

gcloud iam service-accounts \
    create $SA_NAME \
    --project $PROJECT_ID

export ROLE=roles/admin

gcloud projects add-iam-policy-binding \
    --role $ROLE $PROJECT_ID \
    --member serviceAccount:$SA

gcloud iam service-accounts keys \
    create gcp-creds.json \
    --project $PROJECT_ID \
    --iam-account $SA

kubectl --namespace crossplane-system \
    create secret generic gcp-creds \
    --from-file creds=./gcp-creds.json
clone playbook
git clone https://github.com/aghilish/crossplane-compositions-vs-terraform-modules.git

cd crossplane-compositions-vs-terraform-modules
install dependencies
kubectl apply --filename dependencies.yaml
wait for all the packages to become healthy
watch kubectl get pkgrev
configure provider
PROJECT_ID=$(gcloud config get-value project)

echo "apiVersion: gcp.upbound.io/v1beta1
kind: ProviderConfig
metadata:
  name: default
spec:
  projectID: $PROJECT_ID
  credentials:
    source: Secret
    secretRef:
      namespace: crossplane-system
      name: gcp-creds
      key: creds" \
    | kubectl apply --filename -
apply XRD
kubectl apply --filename xrd.yaml
apply composition
kubectl apply --filename composition.yaml
create infra namespace
kubectl create namespace a-team
apply claim
kubectl apply --filename a-team/claim.yaml -n a-team
verify resources
kubectl get clusterclaims.example.org -n a-team
kubectl describe CompositeCluster.example.org
kubectl get clusters,nodepools
access the GKE cluster
kubectl --namespace a-team  \
    get secret a-team-gke-cluster \
    --output jsonpath="{.data.kubeconfig}" \
    | base64 -d \
    | tee kubeconfig.yaml

export KUBECONFIG=$PWD/kubeconfig.yaml

kubectl get nodes

kubectl get namespaces
destroy infrastructure
unset KUBECONFIG
kubectl delete -n a-team --filename a-team/claim.yaml
Crossplane Composition Functions
Links
- Video By Shahrooz Aghili
- Video By Steven Borrelli
- Intro to Crossplane - Video by Shahrooz Aghili
- Crossplane Compositions vs Terraform Modules - Video by Shahrooz Aghili
- How to Write a Crossplane Composition Function in Go
- Crossplane
- Docs
Why Functions?
Crossplane is an advanced tool for managing infrastructure in the cloud-native ecosystem. Crossplane encourages platform engineers to compose their cloud resources by defining their tailor made compositions. Compositions can be simply written as an array of resources. This is somehow similar to how Terraform allows platform engineers to define modules and compose terraform resources.
As Crossplane is an extension to the kuberenets api, the resources need to be defined as an array in
yaml. This makes the configuration management a tedious task, especially if the composition consists of many resources. There will be too much yaml to handle. Starting from version1.11, crossplane introduced thev1alpha1version of the composition functions. With version1.14the functions api is versioned atv1beta1.
Limitations of Compositions
Managing resources with an array has this limitations.
Loops
There is no way to loop through a list to provision resources
for subnet in subnets
    provision subnet
Conditionals
if condition is true then
    provision ManagedInstance
Flexibility
Functions are developed in separate release cycles from crossplane core. This makes updates more flexible.
Functions Goals
The crossplane team aims to achive these goals with functions
- NOT to build a domain specific language (DSL) in yaml
- Support complex logic
- Able to write in any language (or use any text-processing tool)
- Easy to write, share and run
- Enable Multi-step pipelines
- Scalability
How it works
When using functions, compositions need to define a pipeline. The pipeline is most analogous to a unix pipeline. Just like in unix pipelines the stdout of one command is piped as stdin to the next one, in crossplane a yaml or json represenation of the desired state is passed into functions. Each function in the pipeline can mutate the state but may not omit any data from the state. Eventually after the pipeline is done, the final desired state is fed into the crossplane provider.
Functions Benefits
-
Modularity: Allows for reusable code, simplifying management of complex compositions.
-
Abstraction: Provides higher-level abstraction, focusing on desired outcomes rather than implementation details.
-
Code Reusability: Enables easy code reuse, reducing duplication and improving organization.
-
Dynamic Configurations: Supports variables, conditionals, and loops for flexible composition definitions.
-
Ecosystem Integration: Integrates with existing libraries, tools, and languages for defining compositions.
Functions Internals
Functions are OCI (Docker) Containers.
Each Container is a gRPC server which interacts with crossplane pods (core).
Crossplane core sends a RunFunctionRequest to the function along with the desired state (yaml text)
and gets back a RunFunctionResponse with the mutated desired state (modified yaml). Once all the functions in the pipeline are done, the final desired state is handed over to the provider. And that's all there is to it... :D
message RunFunctionRequest {
    RequestMeta meta = 1;
    State observed = 2;
    State desired = 3;
    optional google.protobuf.Struct input = 4;
}
Playbook
Clone the repo
git clone git@github.com:aghilish/function-add-k8s-labels-annotations.git
cd function-add-k8s-labels-annotations
Build and Push the OCI container image
# Run code generation - see input/generate.go
$ go generate ./...
# Run tests - see fn_test.go
$ go test ./...

$ export TAG=v0.0.1

$ docker image build --tag c8n.io/aghilish/function-add-k8s-labels-annotations:$TAG .

$ docker image push c8n.io/aghilish/function-add-k8s-labels-annotations:$TAG

$ yq --inplace ".spec.package = \"c8n.io/aghilish/function-add-k8s-labels-annotations:$TAG\"" example/production/functions.yaml
Running locally
You can run your function locally and test it using crossplane beta render
with these example manifests.
# Run the function locally
$ go run . --insecure --debug
# Then, in another terminal, call it with these example manifests
$ cd example/local
$ crossplane beta render xr.yaml composition.yaml functions.yaml -r
Build runtime image
# Build the function's runtime image - see Dockerfile
$ docker build . --tag=runtime

# Build a function package - see package/crossplane.yaml
$ crossplane xpkg build -f package --embed-runtime-image=runtime
Production Deployment
$ kind create cluster --wait 5m

$ helm repo add crossplane-master https://charts.crossplane.io/master --force-update

$ helm upgrade --install crossplane --namespace crossplane-system --create-namespace crossplane-master/crossplane --devel --set "args={--debug,--enable-usages}"

$ cd example/production

$ kubectl apply -f functions.yaml

## wait untily healthy
$ kubectl get function -w

$ kubectl apply -f composition.yaml
$ kubectl apply -f xrd.yaml

$ kubectl apply -f aws-provider.yaml
$ kubectl apply -f aws-providerconfig.yaml

$ kubectl create secret generic aws-creds -n crossplane-system --from-file=creds=./aws-credentials.txt
# The Example Claim creates a VPC and InternetGateway. After the
# composition pipelines are complete, each resource should have
# the labels and annotations in the Composition pipeline input added.
$ kubectl apply -f claim.yaml
Destroy Infrastructure
$ kubectl delete -f claim.yaml
$ kind delete clusters kind
Helm
100Days Resources
- Video by Anais Urlichs
- Add your blog posts, videos etc. related to the topic here!
Learning Resources
- https://codefresh.io/helm-tutorial/getting-started-with-helm-3/
- https://helm.sh/docs/intro/install/
- https://github.com/cdwv/awesome-helm
- Tutorial with Helm example deployments with Mr Podtato Head
Example Notes
In its simplest form, Helm is a package manager for Kubernetes. It is basically used to manage Kubernetes Applications through Helm templates.
The combination of Helm templates and values is called a Helm Chart
The goal: Make Kubernetes resources more accessible.
Helm 3 is SUPER different from Helm 2 — NO MORE TILLER For more information, please refer to this guide.
Each release goes through multiple stages, including its installation, upgrade, removal, and rollback. With Helm, you can group multiple microservices together and treat them as one entity. You can either create your own chart or use an existing one from Helm Artifact Hub. Once your application is packaged into a Helm chart, it can easily be shared and deployed on Kubernetes. Source
Charts make it super easy to:
- Create Kubernetes Manifests,
- Version your Kubernetes resources
- Share your resources
- And publish your resources
"Helm is a graduated project in the CNCF and is maintained by the Helm community."
You can also reuse existing charts, there is a separate site for Helm Charts https://artifacthub.io/
Imagine this to be similar to the Docker Hub — just for Kubernetes in Chart format (don't quote me on this please)
What you need to use Helm:
- A machine
- Kubernetes — kubectl installed
- A Kubernetes cluster (ANY cluster should be fine for our purposes)
- Install Helm
- USE Helm
Who would I recommend to use Helm
- If you are a completely beginner — you don't have to know Kubernetes — take complex business knowledge, pack it up so that other people can use it
- If you are going advanced
- Not necessarily for HUGE applications
We are using Helm
To install Helm, head over to the
- Installation Guide: https://helm.sh/docs/intro/install/
Ensure that Helm is actually available on your machine:
helm version
Now, you can get started super easy just by running
mkdir charts

cd charts

helm create example-chart
This will create a basic Helm boiler template. Have a look at the presentation that walked through the different files that we have within that Helm chart.
The Chart Structure
Now before we actually install our Helm Chart, we want to make sure that it is all set-up properly
helm install --dry-run --debug example-chart ./example-chart
This will populate our templates with Kubernetes manifests and display those within the console. The benefit is that if you are already familiar with Kubernetes manifests, you will be able to cross-check the Kubernetes resource — and, if needed, make changes to your Kubernetes resources.
Once we are happy with what Helm will create, we can run:
helm install example-chart ./example-chart
Note that in this case, the name of my chart is "example-chart" you can name your chart however, you want to; just make sure that your are specifying the right path to your Helm chart.
Now we can have a look at the installed chart:
helm ls
And the history of events of our installed Chart:
helm history example-chart
If you are using Helm for your deployments, you want to store your Helm charts within a Helm repository. This will allow you to access your Helm charts over time.
Once you have deployed a Helm Chart, you can also upgrade it with new values
helm upgrade [RELEASE] [CHART] [flags]
To remove our example chart:
helm delete example-chart
Second Helm Exercise
Helm Commands
Search for all helm repositories on the helm hub: https://artifacthub.io/
helm search hub
Add a repositories
helm repo add <name> <repository link>
e.g. helm repo add bitnami https://charts.bitnami.com/bitnami
From https://artifacthub.io/packages/helm/bitnami/mysql
List repositories all repositories that you have installed
helm repo list
Search within a repository
helm search repo <name>
Instead of using the commands, you can also search the chart repository online.
To upgrade the charts in your repositories
helm repo update
Install a specific chart repository
helm install stable/mysql --generate-name
Note that you can either ask Helm to generate a name with the —generate-name flag,
or you can provide the name that you want to give the chart by defining it after install
helm install say-my-name stable/mysql
Check the entities that got deployed within a specific cluster:
List all the charts that you have deployed with the following command
helm ls
To remove a chart use
helm uninstall <name of the chart>
In the next section, we are going to look at ways that you can customize your chart.
Helm Part 2
Setting up and modifying Helm Charts
100Days Resources
- Video by Anais Urlichs
- Add your blog posts, videos etc. related to the topic here!
Learning Resources
- https://helm.sh/docs/chart_template_guide/getting_started/
Example Notes
Charts are the packages that Helm works with — these are then turned into Kubernetes manifests and installed on your cluster.
You can easily go ahead and create a chart template
helm create <name of your choice>
Chart names must be lower case letters and numbers. Words may be separated with dashes (-)
YAML files should be indented using two spaces (and never tabs).
This chart is based on the nginx image.
This chart template is especially useful if you are developing a stateless chart — we will cover other starting points later on.
With the following command, you can go ahead and install the chart
helm install <chart name> <location of your chart>
as we have seen in the previous days.
Note that your Kubernetes cluster needs to have access to the Docker Hub to pull the image from there and use it.
This chart runs Nginx out of the box — the templates within the charts are used to set-up the Kubernetes manifests.
- Helm Template Syntax and creating Templates
Helm uses the Go text template engine provided as part of the Go standard library. The syntax is used in kubectl (the command-line application for Kubernetes) templates, Hugo (the static site generator), and numerous other applications built in Go.
Note that you do not have to know Go to create templates.
To pass custom information from the Chart file to the template file, you have to use annotation.
-
You can control the flow of the template generation using:
-
if/elsefor creating conditional blocks.{{- if .Values.ingress.enabled -}} ... {{- else -}} # Ingress not enabled {{- end }}The syntax is providing an "if/then" logic — which makes it possible to have default values if no custom values are provided within the values.yaml file.
-
withto set a scope to a particular objectcontainers: - name: {{ .Release.name }} {{- with .Values.image }} image: repository: .repo pullPolicy: .pullPolicy tag: .tag {{- end }}while the values.yaml file contains
image:
  repo: my-repo
  pullPolicy: always
  tag: 1.2.3
In this example the scope is changed from the current scope which is
.to another object which is.Values.image. Hence,my-repo,alwaysand1.2.3were referenced without specifying.Values.images..WARNING: Other objects can not be accessed using
.from within a restricted scope. A solution to this scenario will be using variables$. -
range, which provides a "for each"-style loopcars: |- {{- range .Values.cars }} - {{ . }} {{- end }}with the values.yaml file contains
cars:
  - BMW
  - Ford
  - Hyundai
Note that
rangetoo changes the scope. But to what? In each loop the scope becomes a member of the list. In this case,.Values.carsis a list of strings, so each iteration the scope becomes a string. In the first iteration.is set toBMW. The second iteration, it is set toFordand in the third it is set toHyundai. Therefore, each item is referenced using.containers: - name: {{ .Release.name }} env: {{- range .Values.env }} - name: {{ .name }} value: {{ .value | quote }} {{- end }}while the values.yaml file contains
env:
  - name: envVar1
    value: true
  - name: envVar2
    value: 5
  - name: envVar3
    value: helmForever
In this case,
.Values.envis a list of dictonary, so each iteration the scope becomes a dictionary. For example, in the first iteration, the.is the first dictionary{name: envVar1, value: true}. In the second iteration the scope is the dictionary{name: envVar2, value: 5}and so on. In addition, you can perform a pipeline on the value of.nameor.valueas shown.
-
-
Special Functions
- With the include function, objects from one template can be used within another template; the first argument is the name of the template, the "." that is passed in refers to the second argument in the root object.
metadata: name: {{ include "helm-example.fullname" . }}- With the required function, you can set a parameter as required. In case it's not passed a custom error message will be prompted.
image: repository: {{ required "An image repository is required" .Values.image.repository }} -
You can also add your own variables to tempaltes
{{ $var := .Values.character }}
- The "toYaml" function turns data into YAML syntax
Helm has the ability to build a chart archive. Each chart archive is a gzipped TAR file with the extension .tgz. Any tool that can create, extract, and otherwise work on gzipped TAR files will work with Helm’s chart archives. Source. Learning Helm Book
- Pipelines
In Helm, a pipeline is a chain of variables, commands and functions which is used to alter a value before placing it in the values.yaml file.
The value of a variable or the output of a function is used as the input to the next function in a pipeline. The output of the final element of a pipeline is the output of the pipeline. The following illustrates a simple pipeline: character:
{{ .Values.character | default "Sylvester" | quote }}
- Writing maintainable templates, here are the suggestions by the maintainers
You may go long periods without making structural changes to the templates in a chart and then come back to it. Being able to quickly rediscover the layout will make the processes faster.
Other people will look at the templates in charts. This may be team members who create the chart or those that consume it. Consumers can, and sometimes do, open up a chart to inspect it prior to installing it or as part of a process to fork it.
When you debug a chart, which is covered in the next section, it is easier to do so with some structure in the templates.
- You can package your Helm chart with the following command.
helm package <chart name>
It is important to think of a Helm chart as a package. This package can be published to a public or private repository. Helm repositories can also be hosted in GitHub, GitLab pages, object storage and using Chartmuseum. You can also find charts hosted in many distributed repositories hosted by numerous people and organizations through Helm Hub (aka Artifact Hub).
K9s
100Days Resources
- Video by Anais Urlichs
- Add your blog posts, videos etc. related to the topic here!
Learning Resources
Example Notes
Managing your kubernetes cluster through kubectl commands is difficult.
- You have to understand how the different components interact, specifically, what resources is linked to which other resource
- Using a UI usually abstracts all the underlying resources, not allowing for the right learning experience to take place + forcing your to click buttons
- You do not have full insights on the resources within your cluster.
These are some of the aspects that K9s can help with.
This is a short intro and tutorial with examples on how you can use K9s to navigate your cluster
What is k9s?
K9s is a terminal-based tool that visualises the resources within your cluster and the connection between those. It helps you to access, observe, and manage your resources. "K9s continually watches Kubernetes for changes and offers subsequent commands to interact with your observed resources." — Taken from their GitHub repository
Installation options:
- Homebrew MacOS and Linux
- OpenSUSE
- Arch Linux
- Chocolatey for Windows
- Install via Go
- Install from source
- Run from Docker container
As you can see there are multiple different options and I am sure you will find the right one for you and your OS.
Some additional features:
- Customise the color settings
- Key Bindings
- Node Shell
- Command Aliases
- HotKeySpport
- Resource Custom Columns
- Plugins
- Benchmark your Application
Have a look at their website for more comprehensive information
Getting up and running
The configuration for K9s is kept in your home directory under .k9s $HOME/.k9s/config.yml.
You can find a detailed explanation on what the file is here: https://k9scli.io/topics/config/
Note that the definitions may change over time with new releases.
To enter the K9s, just type k9s into your terminal.
Show everything that you can do with K9s, just type
?
Or press:
ctrl-a
Which will show a more comprehensive list.
Search for specific resources type
:<name>
The name could for instance refer to "pods", "nodes", "rs" (for ReplicaSet) and other Kubernetes resources that you have already been using. Once you have selected a resource, for instance, a namespace, you can search for specific namespaces using "/"
Have a look at deployments
:dp
To switch between your Kubernetes context type:
:ctx
You can also add the context name after the command if you want to view your Kubernetes context and then switch.
To delete a resource type press: ctrl-d
To kill a resource, use the same command but with k: ctrl-k
Change how resourc4es are displayed:
:xray RESOURCE
To exist K9s either type
:q
Or press: ctrl-c
k9s interaction with Kubernetes
If you are changing the context or the namespace with kubectl, k9s will automatically know about it and show you the resources within the namespace.
Alternatively, you can also specify the namespace through K9s like detailed above.
k9s for further debugging and benchmarking
K9s integrates with Hey, which is a CLI tool used to benchmark HTTP endpoints. It currently supports benchmarking port-forwards and services (Source)
To port forward, you will need to selects a pod and container that exposes a specific port within the PodView.
With SHIFT-F a dialog will pop up and allows you to select the port to forward to.
Once you have selected that, you can use
:pf
to navigate to the PortForward view and list out all active port-forward.
Selecting port-forward + using CTRL-B will run a benchmark on that http endpoint.
You can then view the results of the benchmark through
:be
Keep in mind that once you exit the K9s session, the port-forward will be removed, forwards only last for the duration of the session.
Each cluster has its own bench-config that can be found at $HOME/.k9s/bench-<my_context>.yml
You can find further information here.
You can debug processes using
k9s -l debug
Change Look
You can change the look of your K9s by changing the according YAML in your .k9s folder.
Here is where the default skin lives: skin.yml
You can find example skin files in the skins directory: https://github.com/derailed/k9s/tree/master/skins
View all the color definitions here: https://k9scli.io/topics/skins/
For further information on how to optimise K9s, check-out their video tutorials.
Knative
100Days Resources
- Video by Anais Urlichs
- Add your blog posts, videos etc. related to the topic here!
Learning Resources
Example Notes
Kubernetes-based platform to deploy and manage modern serverless workloads. Knative's serving component incorporates Istio, which is an open source tool developed by IBM, Google, and ridesharing company Lyft to help manage tiny, container-based software services known as microservices.
Introduce event-driven and serverless capabilities to Kubernetes clusters. Knative combines two interesting concepts Serverless and Kubernetes Container Orchestration. With Kubernetes, developers have to set-up a variety of different tools to make everything work together, this is time consuming and difficult for many. Knative wants to bring the focus back on writing code instead of managing infrastructure.
Knative allows us to make it super easy to deploy long-running stateless application on top of Kubernetes.
What is Knative?
A Kubernetes extension consistent of custom controllers and custom resource definitions that enable new use cases on top of Kubernetes.
A platform installed on top of Kubernetes that brings serverless capabilities to Kubernetes — with its additional features, it makes it super easy to go serverless on top of Kubernetes.
The Goal: Making microservice deployments on Kubernetes really easy.+
Serverless style user experience that lives on top of Kubernetes.
It consists of three major components:
- Note that this part has been deprecated but you will still find it in a lot of tutorials. Build: Every developer has code — then turn it into a container — either one step or consistent of multiple step. Next, push the image to a cloud registry. These are a lot of steps — Knative can do all of this within the cluster itself, making iterative development possible.
- Serve: Knative comes with Istio components, traffic management, automatic scaling. It consists of the Route and the Config — every revision of our service is managed by the config
- Event: You need triggers that are responded to by the platform itself — it allows you to set-up triggers. Also, you can integrate the eventing with your ci/cd flow to kick off your build and serve stages.
Note that you can use other Kubernetes management tools together with Knative
Features:
- Focused API with higher level abstractions for common app use-cases.
- Stand up a scalable, secure, stateless service in seconds.
- Loosely coupled features let you use the pieces you need.
- Pluggable components let you bring your own logging and monitoring, networking, and service mesh.
- Knative is portable: run it anywhere Kubernetes runs, never worry about vendor lock-in.
- Idiomatic developer experience, supporting common patterns such as GitOps, DockerOps, ManualOps.
- Knative can be used with common tools and frameworks such as Django, Ruby on Rails, Spring, and many more.
Knative offers several benefits for Kubernetes users wanting to take their use of containers to the next level:
- Faster iterative development: Knative cuts valuable time out of the container building process, which enables you to develop and roll out new container versions more quickly. This makes it easier to develop containers in small, iterative steps, which is a key tenet of the agile development process.
- Focus on code: DevOps may empower developers to administer their own environments, but at the end of the day, coders want to code. You want to focus on building bug-free software and solving development problems, not on configuring message bus queues for event triggering or managing container scalability. Knative enables you to do that.
- Quick entry to serverless computing: Serverless environments can be daunting to set up and manage manually. Knative allows you to quickly set up serverless workflows. As far as the developers are concerned, they’re just building a container—it’s Knative that runs it as a service or a serverless function behind the scenes.
There are two core Knative components that can be installed and used together or independently to provide different functions:
- Knative Serving: Provides request-driven compute that can scale to 0. The Serving component is responsible for running/hosting your application. Easily manage stateless services on Kubernetes by reducing the developer effort required for autoscaling, networking, and rollouts.
- Knative Eventing: Management and delivery of events — manage the event infrastructure of your application. Easily route events between on-cluster and off-cluster components by exposing event routing as configuration rather than embedded in code.
These components are delivered as Kubernetes custom resource definitions (CRDs), which can be configured by a cluster administrator to provide default settings for developer-created applications and event workflow components.
Additionally, knative keeps track of your revisions.
Revisions
- Revisions of your application are used to scale up the resources once you receive more requests
- If you are deploying a change/update, revisions can also be used to gradually move traffic from revision 1 to revision 2
- You can also have revisions that are not part of the networking scheme — in which case, they have a dedicate name and endpoint.
Prerequisites
- Kubernetes cluster with v1.17 or newer, note that most have 1.18 already by default but you might want to check
- Kubectl that is connected to your cluster
The resources that are going to be deployed through Serving
Knative Serving defines a set of objects as Kubernetes Custom Resource Definitions (CRDs). These objects are used to define and control how your serverless workload behaves on the cluster:
- Service:
The
service.serving.knative.devresource automatically manages the whole lifecycle of your workload. It controls the creation of other objects to ensure that your app has a route, a configuration, and a new revision for each update of the service. Service can be defined to always route traffic to the latest revision or to a pinned revision. - Route:
The
route.serving.knative.devresource maps a network endpoint to one or more revisions. You can manage the traffic in several ways, including fractional traffic and named routes. - Configuration:
The
configuration.serving.knative.devresource maintains the desired state for your deployment. It provides a clean separation between code and configuration and follows the Twelve-Factor App methodology. Modifying a configuration creates a new revision. - Revision:
The
revision.serving.knative.devresource is a point-in-time snapshot of the code and configuration for each modification made to the workload. Revisions are immutable objects and can be retained for as long as useful. Knative Serving Revisions can be automatically scaled up and down according to incoming traffic. See Configuring the Autoscaler for more information.

With the Service resource, a deployed service will automatically have a matching route and configuration created. Each time the Service is updated, a new revision is created.
Configuration creates and tracks snapshots of how to run the user's software called Revisions. Since it keeps track of revisions, it allows you to roll back to prevision revisions should you encounter an issue within new deployments.
Data-path/Life of a Request
Installation
Installing the knative serving component
kubectl apply --filename https://github.com/knative/serving/releases/download/v0.20.0/serving-crds.yaml
Installing the core serving component
kubectl apply --filename https://github.com/knative/serving/releases/download/v0.20.0/serving-core.yaml
Installing Istio for Knative https://knative.dev/docs/install/installing-istio/
Install the Knative Istio controller:
kubectl apply --filename https://github.com/knative/net-istio/releases/download/v0.20.0/release.yaml
Fetch the External IP or CNAME:
kubectl --namespace istio-system get service istio-ingressgateway
Issue to delete webhooks
https://github.com/knative/serving/issues/8323
Configure DNS
Head over to the docs
https://knative.dev/docs/install/
Monitor the Knative components until all of the components show a STATUS of Running or Completed:
kubectl get pods --namespace knative-serving
You can also use knative with their cli-tool.
Note: Make sure that you have enough resources/capacity of your cluster. If you do receive an error message, increase the capacity of your cluster and rerun commands.
So the process is now
- The client opens the application
- Which will then forward the request to the Loadbalancer that has been created when we installed Istio (this will only be created on a 'proper cluster')
- The LoadBalancer will then forward our request to the Istio Gateway — which is responsible for fulfilling the request connected to our application.
For a stateless application, there should be as a minimum, the following resources:
- Deployment
- ReplicaSet
- Pod
- Pod Scalar to ensure the adequate number of pods are running
- We need a Service so that other Pods/Services can access the application
- If the application should be used outside of the cluster, we need an Ingress or similar
So what makes our application serverless?
When Knative realises that our application is not being used for a while, it will remove the pods needed to run the application ⇒ Scaling the app to 0 Replicas
Knative is a solution for Serverless workloads, it not only scales our application but also queues our requests if there are no pods to handle our requests.
Resources
- Website https://knative.dev/
- Documentation https://knative.dev/docs/
- YouTube video https://youtu.be/28CqZZFdwBY
If you set a limit of how many requests one application can serve, you can easier see the scaling functionality of Knative in your cluster.
kn service update <nameofservice> --concurrency-limit=1
GitOps and Argo CD
Links
- Video by Shahrooz Aghili on Argo CD
- Argo CD
- Docs
- The DevOps Toolkit has several great explanations and tutorials around GitOps and ArgoCD
Why Argo CD
Argo CD represents a significant leap in the domain of DevOps, particularly in the adoption of GitOps principles.
Argo CD is a part of the Argo project and a CNCF Graduated project.

Pull vs. Push Model in GitOps
-
Enhanced Security and Autonomy:
- Pull model enhances security by reducing attack vectors.
- Allows for cluster autonomy by applying changes internally.
-
Self-Management and Consistency:
- Clusters are self-managed, updating without external dependencies.
- Ensures a consistent state with the repository.
-
Resilience and Reduced Credential Exposure:
- Pull systems are resilient, not relying on external services.
- Minimizes credential exposure outside the cluster.
-
Scalability and Dynamic Updates:
- Better scalability by offloading work to individual clusters.
- Supports event-driven, dynamic updates.
-
Operational Efficiency:
- Reduces overhead on CI systems, with the cluster managing deployment work.
- Leads to lower operational complexity.
Benefits
-
Robust Security and Automated Synchronization:
- Utilizes Git's security features for safe deployments.
- Automatically syncs states as defined in Git.
-
Ease of Operations:
- Facilitates easy rollbacks.
- Encourages declarative infrastructure setup.
- Simplifies complex deployments.
-
Cost-Effective and Community-Driven:
- Open-source nature allows free usage and community contributions.
-
Real-Time Oversight and Multi-Cluster Management:
- Offers real-time application status monitoring.
- Manages deployments across multiple clusters.
-
Self-Healing and Community Support:
- Automatically corrects state drifts.
- Benefits from the support and innovation of the GitOps community.
Linkerd
100Days Resources
- Video by Anais Urlichs
- Add your blog posts, videos etc. related to the topic here!
Learning Resources
Example Notes
If you want to get started with Linkerd, for the most part, just follow their Documentation. :)
In some of the previous videos, we looked as Service Mesh, and specifically at Istio. Since many people struggle to set-up Istio I thought it would be great to take another look at a different Service Mesh. In this case, at Linkerd.
Note that Istio is still one of the most popular. Thus, it is always good to still know about that but as an alternative, let's also take a look at Linkerd.
Benefits of Linkerd
It works as it is — Saiyam
- First service mesh project that introduced the term
- In production for about 4 years
- Open governance model and hosted by the CNCF
- Super extensible and easy to install add-ons
- Easy to install
- It is a community project
- Kept small, you should spend the least amount of resources
More information
Control plane written in Go and data plane written in Rust.
Installation
LinkerD has a really neat getting-started documentation that you can follow step-by-step.
First, we are going to follow the onboarding documentation. Once we have everything set-up and working, we want to see metrics of our application through Prometheus and Grafana.
Usually I would copy paste commands to make sure everyone knows the order but since their documentation is pretty straight-forward, I am not going to do that this time.
- Let's follow the steps detailed in the getting-started documentation https://linkerd.io/2.10/getting-started/
In our case, we are going to try it out on our Docker for Desktop Kubernetes cluster but you could also use another cluster such as KinD.
Small side-note, I absolutely love that they have a checker command to see whether LinkerD can actually be installed on your cluster
linkerd check --pre
How amazing is that?
And then, they have a separate command to see whether all the resources are ready
linkerd check
I am already in love with them!
We are going to keep following the guide, because we want to have a fancy dashboard with metrics in the end
linkerd viz install | kubectl apply -f -
linkerd jaeger install | kubectl apply -f -
Then we are going to check that everything is ready
linkerd check
Access the dashboard
**linkerd viz dashboard &**
this will give you the localhost port to a beautiful Dashboard
We are going to use the following GitHub respository to install our application
https://github.com/AnaisUrlichs/react-article-display
After clone, cd into react-article-display
Now you want to have Helm istalled since this application relies on a Helm Chart
helm install react-article ./charts/example-chart
Once installed, we can port-forward to access our application
kubectl por-forward service/react-article-example-chart 5000:80
Now we just have to connect our Service Mesh with the application
kubectl get deploy -o yaml \
  | linkerd inject - \
  | kubectl apply -f -
Then we can go ahead and run checks again
linkerd check --proxy
We can see the live stats of our application through
linkerd viz stat deploy
And see the stream of requests to our services throug
linkerd viz tap deploy/web
Now let's go ahead and see how we can do traffic splitting for Canary deployments with Linkerd. For this, we are going to follow the documentation https://linkerd.io/2.10/tasks/canary-release/
Clone the following repository
Apply the first application
kubectl apply -f app-one.yaml
You can access it through kubectl port forwarding
kubectl port-forward service/app-one 3000:80
Install Flagger
kubectl apply -k github.com/fluxcd/flagger/kustomize/linkerd
Deploy the deployment resource
kubectl create ns test && \
  kubectl apply -f https://run.linkerd.io/flagger.yml
Ensure they are ready
kubectl -n test rollout status deploy podinfo
Access the service
kubectl -n test port-forward svc/podinfo 9898
kubectl -n test get ev --watch
Prometheus
100Days Resources
- Video by Anais Urlichs
- Add your blog posts, videos etc. related to the topic here!
Learning Resources
- Overview video https://youtu.be/nk3sk1LO7Bo quick
- Overview video https://youtu.be/sYMTY-SciUQ long
- The Prometheus documentation
- The Grafana documentation
- Have a look at the different yaml files that encompass Pormetheus https://phoenixnap.com/kb/prometheus-kubernetes-monitoring
- Challenges using Prometheus at scale https://sysdig.com/blog/challenges-scale-prometheus/
- Another quick tutorial https://dev.to/rayandasoriya/kubernetes-monitoring-with-prometheus-2l7k
This is a really useful series by Sysdig
- https://sysdig.com/blog/kubernetes-monitoring-prometheus/
- https://sysdig.com/blog/kubernetes-monitoring-with-prometheus-alertmanager-grafana-pushgateway-part-2/
- https://sysdig.com/blog/kubernetes-monitoring-prometheus-operator-part3/
Example Notes
Prometheus is a time-series database that came out of soundcloud to monitor our processes that might span various different systems. It is basically a tool used to monitor the performance of your infrastructure.
- DevOps needs more automation.
- Want to be notified about storage issues.
- Part of the CNCF landscape
If you have hundred of microservices, you have to have complex monitoring in place. You want to know when your application is not running as expected.
Note that what we want to measure and how we want to measure it highly depends on the type of our application.
Why do we want to use Prometheus for our monitoring on Kubernetes?
- Key-value pair based — similar to how Kubernetes metadata organises labels
- "Prometheus is a good fit for microservices because you just need to expose a metrics port, and don’t need to add too much complexity or run additional services. Often, the service itself is already presenting a HTTP interface, and the developer just needs to add an additional path like /metrics." Source
At its core component
- Prometheus server
- Storage: Time series database
- Data Retrieval Worker
- Http server: accepts queries
- Prometheus has an Altertmanager : "The AlertManager receives metrics from the Prometheus server and then is responsible for grouping and making sense of the metrics and then forwarding an alert to your chosen notification system"
How does it work?
Prometheus operates under the pull-based model. By sending http requests to the endpoint it is supposed to monitor, the target, it scrapes information from that target. The response to this scrape request is stored and parsed in storage along with the metrics for the scrape itself.
Metrics have type and help attributes
- help: what the metrics is
- type: metrics type
Prometheus pulls data from end-points — can easily detect whether a service is up and running e.g. if the end-point does not respond.
Vs. push system — applications and servers are responsible for pushing data — this creates a high traffic load. In this case, you might be overloading your infrastructure.
If Pormetheus is unable to access the labels of your application, an exporter can be used. There are a lot of different exporters. The exporter you use will depend on the type of application that you want to expose data of.
Here is one overview from 2018 — the overview provided on the official documentation looks a bit more complex than this one. Note the direction of the arrows.
Source: https://youtu.be/sYMTY-SciUQ
Additional notes
- You define what targets it is supposed to scape and the interval it should scape at in the yaml file.
- Expects metrics to be available at "/metrics".
- Usually, the yaml file has a default job that can be overwritten with custom jobs.
- Prometheus has something called prompt ql — which is the prometheus query language.
- Grafana is used to pull data out of prometheus.
- By default Prometheus comes with a UI that can be opened on port 9090
Some labels are provided from the application itself and others come directly from the Prometheus server since it knows what it scrapes.
Things can go wrong for a variety of reasons, such as
- Disk Full : No new data can be store
- Software Bug : Request Errors
- High Temperature : Hardware Failure
- Network Outage : Services cannot communicate
- Low Memory Utilization : Money wasted
Note that you can integrate long-term storage with Prometheus but usually if a node fails, the data received until that point will be gone too.
You can expose to Prometheus the following
- node
- endpoint
- service
- pod
- ingress
Some of the downsides using Prometheus at scale
- "It doesn’t allow global visibility. Several production clusters would make this a new requirement."
- "Operations can be cumbersome and time consuming."
- "This model can complicate governance and regulatory compliance"
- "Prometheus is not designed to be scaled horizontally. Once you hit the limit of vertical scaling, you’re done."
Install
To learn more about Prometheus, this repository is really great https://github.com/yolossn/Prometheus-Basics
Using Prometheus without Kubernetes on a node.js application
https://github.com/csantanapr/prometheus-nodejs-tutorial
Following this tutorial to set-up both Prometheus and Grafana
https://grafana.com/docs/grafana-cloud/quickstart/prometheus_operator/
Prometheus is based on a Kubernetes Operator. Let's take a closer look at Kubernetes Operators. In short, they are used to develop tools and resources on top of Kubernetes. You can use Kubernetes Operators to create new custom resources.
Installation
The Prometheus operator is provided. A deployment, a required ClusterRole with associated ClusterRoleBinding and a ServiceAccount are defined. We can create all of those through the following tutorial.
- Blog post on using Prometheus and Grafana https://medium.com/devops-dudes/install-prometheus-on-ubuntu-18-04-a51602c6256b
Install the Prometheus operator — I am going to use Helm because it is probably the most straightforward to use vs. any of the other options.
helm repo add prometheus-community https://prometheus-community.github.io/helm-charts

helm repo update

helm install prom prometheus-community/kube-prometheus-stack
To access the Prometheus UI, use the following
kubectl port-forward prometheus-prometheus-prometheus-oper-prometheus-0 9090
Note that the prometheus might not be in namespace — if you have installed it in a namespace, make sure to specify the namespace.
Now do the same with the Grafana Dashboard
kubectl port-forward prometheus-grafana-5c5885d488-b9mlj 3000
Here again, the resource might or might not be in a namespace.
To login, you have to get your password etc.
kubectl get secret --namespace prometheus prometheus-grafana -o yaml
username: admin
password: prom-operator
Note again that you might have to replace the values.
Now you can access the metrics. Have a look at the following video for a detailed overview:
We want to monitor an application, which we are going to do by following this Readme:
To access the deployment in yaml format
kubectl describe deployment prometheus-prometheus-oper-operator > oper.yaml
Prometheus Exporter
100Days Resources
- Video by Anais Urlichs
- Add your blog posts, videos etc. related to the topic here!
Learning Resources
Example Notes
Install Prometheus Helm Chart with Operators etc.
First off, we are going to follow the commands provided in the previous day — Day 28 — on Prometheus to have our Helm Chart with all the Prometheus related resources installed.
Have a look at the Prometheus Resources to understand those better
Prometheus uses ServiceMonitors to discover endpoints. You can get a list of all the ServiceMonitors through:
kubectl get servicemonitor
Now have a look at one of those ServiceMonitors:
kubectl get servicemonitor prometheus-kube-prometheus-grafana -o yaml
This will display the ServiceMonitor definition in pure YAML inside our terminal. Look through the YAML file and you will find a label called:
"release: prometheus"
This label defines the ServiceMonitors that Prometheus is supposed to scrape.
Like mentioned in the Previous video, operators, such as the Prometheus Operator rely on CRD. Have a look at the CRDs that Prometheus uses through:
kubectl get crd
You can take a look at a specific one as follows.
kubectl get prometheus.monitoring.coreos.com -o yaml
Set-up MongoDB
Now, we want to install a MongoDB image on our cluster and tell Prometheus to monitor it's endpoint. However, MongoDB is one of those images that relies on an exporter for its service to be visible to Prometheus. Think about it this way, Prometheus needs the help of and Exporter to know where MongoDB is in our cluster — like a pointer.
You can learn more about those concepts in my previous videos
- Prometheus on Kubernetes: Day 28 of #100DaysOfKubernetes
- Kubernetes Operators: Day 29 of #100DaysOfKubernetes
First off, we are going to install the MongoDB deployment and the MongoDB service; here is the YAML needed for this:
deployment.yaml
apiVersion: apps/v1
kind: Deployment
metadata:
  name: mongodb-deployment
  labels:
    app: mongodb
spec:
  replicas: 2
  selector:
    matchLabels:
      app: mongodb
  template:
    metadata:
      labels:
        app: mongodb
    spec:
      containers:
      - name: mongodb
        image: mongo
        ports:
        - containerPort: 27017
service.yaml
apiVersion: v1
kind: Service
metadata:
  name: mongodb-service
spec:
  selector:
    app: mongodb
  ports:
  - protocol: TCP
    port: 27017
    targetPort: 27017
Use the follow to apply both to your cluster
kubectl apply -f deployment.yaml
kubectl apply -f service.yaml
You can check that both are up and running through
kubectl get all
# or

kubectl get service
kubectl get pods
Now we want to tell Prometheus to monitor that endpoint — for this, we are going to use the following Helm Chart https://github.com/prometheus-community/helm-charts/tree/main/charts/prometheus-mongodb-exporter
You can find a list of Prometheus exporters and integrations here:
https://prometheus.io/docs/instrumenting/exporters/
Next, we are going to add the Helm Mongo DB exporter
helm repo add prometheus-community https://prometheus-community.github.io/helm-charts
helm show values prometheus-community/prometheus-mongodb-exporter > values.yaml
We need to mondify the values provided in the values.yaml file as follows:
mongodb:
  uri: "mongodb://mongodb-service:27017"

serviceMonitor:
  enabled: true
  additionalLabels:
    release: prometheus
Basically, replace the values.yaml file created in the helm show command above with this file. In this case, we are going to tell the helm chart the mongodb endpoint and then the additional label for the ServiceMonitor.
Next, let's install the Helm Chart and pass in the values.yaml
helm install mongodb-exporter prometheus-community/prometheus-mongodb-exporter -f values.yaml
You can see whether the chart got installed correctly through
helm ls
Now have a look at the pods and the services again to see whether everything is running correctly:
kubectl get all
# or

kubectl get service
kubectl get pods
Lastly make sure that we have the new ServiceMonitor in our list:
kubectl get servicemonitor
Have a look at the prometheus label within the ServiceMonitor
kubectl get servicemonitor mongodb-exporter-prometheus-mongodb-exporter -o yaml
Now access the service of the mongodb-exporter to see whether it scrapes the metrics of our MongoDB properly:
kubectl port-forward service/mongodb-exporter-prometheus-mongodb-exporter 9216
and open the Prometheus service:
kubectl port-forward service/prometheus-kube-prometheus-prometheus 9090
On localhost:9090, go to Status - Targets and you can see all of our endpoints that Prometheus currently knows about.
Kubernetes Operators
100Days Resources
- Video by Anais Urlichs
- Add your blog posts, videos etc. related to the topic here!
Learning Resources
- https://youtu.be/ha3LjlD6g7g
- https://www.redhat.com/en/topics/containers/what-is-a-kubernetes-operator
- https://kubernetes.io/docs/concepts/extend-kubernetes/operator/
Example Notes
There is so much great content around Kubernetes Operators, and I have mentioned it several times across the previous videos. However, we have not looked at Kubernetes Operators yet. Today, we are going to explore
- What are Kubernetes Operators
- How do Operators work
- Why are they important
Operators are mainly used for Stateful Applications
Operators are software extensions to Kubernetes that make use of custom resources to manage applications and their components. Operators follow Kubernetes principles, notably the control loop — Source
Managing Stateful Applications without an operator vs. with an operator.
If you are deploying an application, you usually use
- Service
- Deployment
- ConfigMap
Kubernetes knows what the desired state of our cluster is because we told it through our configuration files. It aims to match the actual state of our cluster to our desired state.
Now for a stateful application the process is a bit more difficult — it does not allow Kubernetes to automatically scale etc.
E.g. SQL databases are not identical replicas. There has to be a constant communication for the data to be consistent + other factors.
Each database has its own workaround —> this makes it difficult to use Kubernetes to automate any workaround.
A lot of times stateful applications will require manual intervention i.e. human operators. However, having to manually update resources in Kubernetes goes against its
So there is a need for an alternative to manage stateful applications. This alternative is a Kubernetes Operator.
What is an Operator?
Replace all the manual tasks that the human operator would do. It takes care of
- Deploying the app
- Creating replicas
- Ensuring recovery in case of failure
With this, an Operator is basically an application-specific controller that extends the functionality of the Kubernetes API to take care of the management of complex applications. This is making tasks automated and reusable.
Operators rely on a control loop mechanism.
If one replica of our database dies, it will create a new one. If the image version of the database get updated, it will deploy the new version.
Additionally, Operators rely on Kubernetes Custom Resource Definitions (CRDs). CRDs are custom resources created on top of Kubernetes. CRDs allow Operators to have specific knowledge of the application that they are supposed to manage.
You can find a list of Kubernetes Operators in the Kubernetes Operator Hub https://operatorhub.io/
AND you can find several awesome operators in the wild https://github.com/operator-framework/awesome-operators 😄
Once you have created an operator, it will take high-level inputs and translate them into low level actions and tasks that are needed to manage the application.
Once the application is deployed, the Operator will continue to monitor the application to ensure that it is running smoothly.
Who is creating Operators?
Those if the insights and know-how of the application that the operator is supposed to run.
There is an Operator Framework that basically provides the building blocks that can be used to
The Operator Framework includes:
- Operator SDK: Enables developers to build operators based on their expertise without requiring knowledge of Kubernetes API complexities.
- Operator Lifecycle Management: Oversees installation, updates, and management of the lifecycle of all of the operators running across a Kubernetes cluster.
- Operator Metering: Enables usage reporting for operators that provide specialized services.
Some of the things that you can use an operator to automate include:
- deploying an application on demand
- taking and restoring backups of that application's state
- handling upgrades of the application code alongside related changes such as database schemas or extra configuration settings
- publishing a Service to applications that don't support Kubernetes APIs to discover them
- simulating failure in all or part of your cluster to test its resilience
- choosing a leader for a distributed application without an internal member election process
Practical Example
In the case of Prometheus, I would have to deploy several separate components to get Prometheus up and running, which is quite complex + deploying everything in the right order.
A Crash Course on Extending Kubernetes - Kubebuilder 2024 - 3.14.0.
Links
Learning Resources
Notes
Kubernetes is highly configurable and extensible. As a result, there is rarely a need to fork or submit patches to the Kubernetes project code.
Extension Points Details
| Declarative APIs | Imperative APIs |
|---|---|
| Your API consists of a relatively small number of relatively small objects (resources). | The client says "do this", and then gets a synchronous response back when it is done. |
| The objects define configuration of applications or infrastructure. | The client says "do this", and then gets an operation ID back, and has to check a separate Operation object to determine completion of the request. |
| The objects are updated relatively infrequently. | You talk about Remote Procedure Calls (RPCs). |
| Humans often need to read and write the objects. | Directly storing large amounts of data; for example, > a few kB per object, or > 1000s of objects. |
| The main operations on the objects are CRUD-y (creating, reading, updating and deleting). | High bandwidth access (10s of requests per second sustained) needed. |
| Transactions across objects are not required: the API represents a desired state, not an exact state. | Store end-user data (such as images, PII, etc.) or other large-scale data processed by applications. |
| The natural operations on the objects are not CRUD-y. | |
| The API is not easily modeled as objects. | |
| You chose to represent pending operations with an operation ID or an operation object. |
Kubernetes is designed to be automated by writing client programs. Any program that reads and/or writes to the Kubernetes API can provide useful automation. Automation can run on the cluster or off it.
There is a specific pattern for writing client programs that work well with Kubernetes called the controller pattern. Controllers typically read an object's
.spec, possibly do things, and then update the object's.status.
“An operator is a Kubernetes controller that understands 2 domains: Kubernetes and something else. By combining knowledge of both domains, it can automate tasks that usually require a human operator that understands both domains”* (Jimmy Zelinskie, https://github.com/kubeflow/tf-operator/issues/300#issuecomment-357527937)
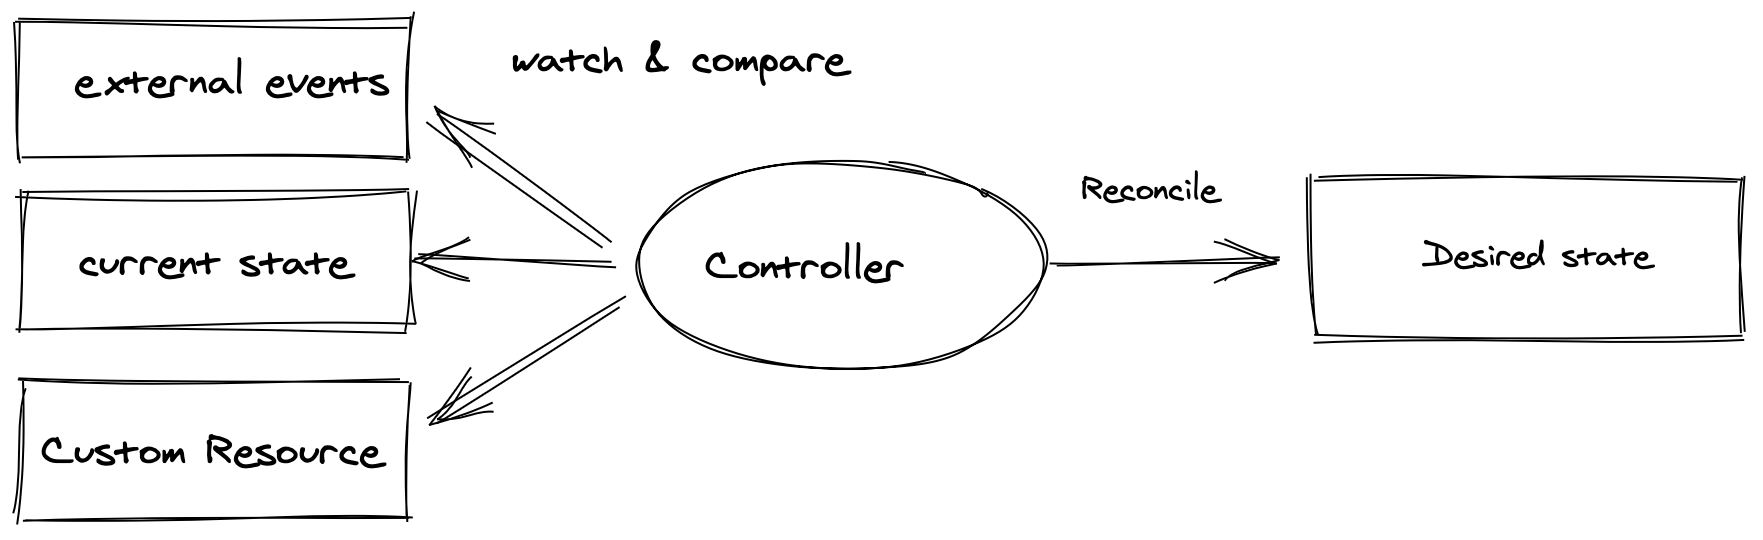
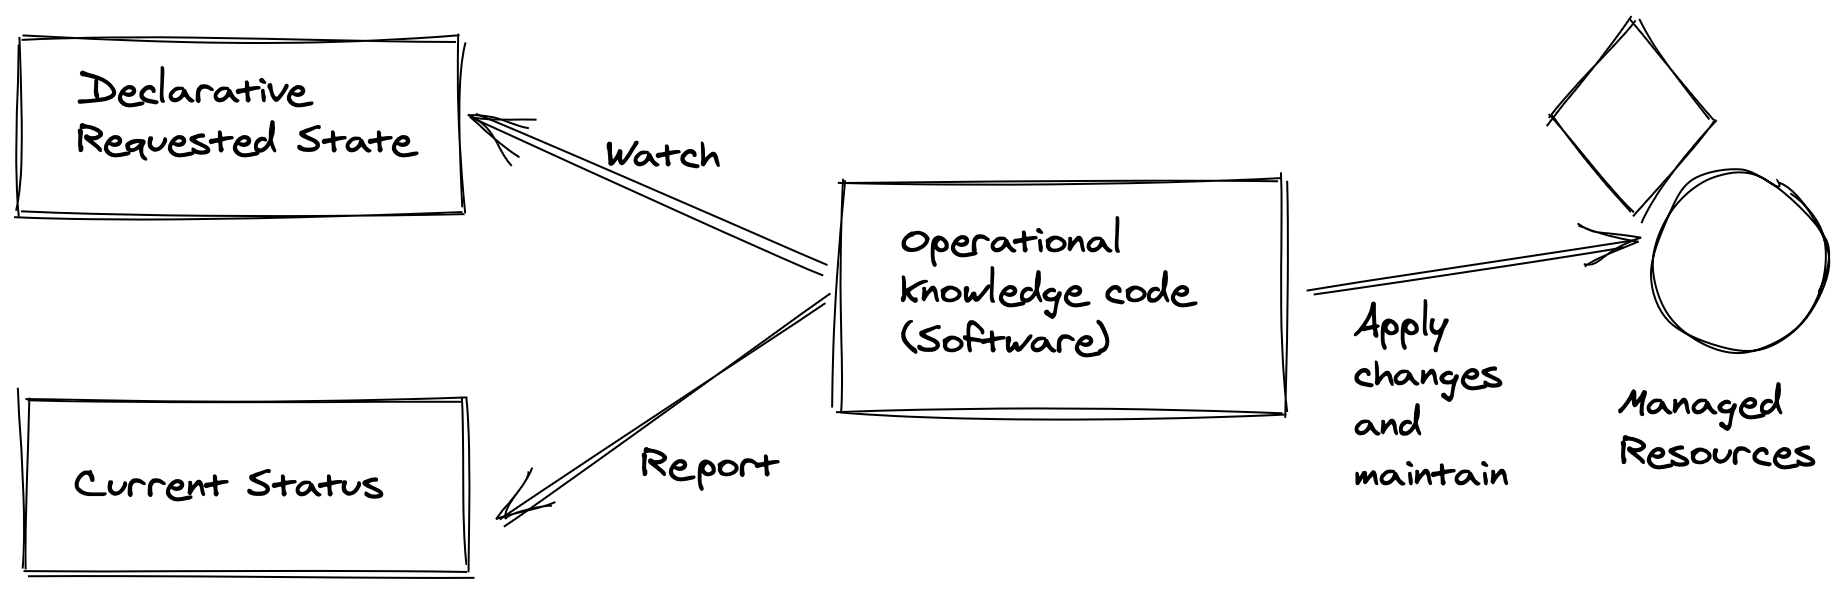
1. A Look into Custom Resource Definition (CRD) API
We need a test cluster. Kind is a good option.
kind create cluster
let's start by using the custom resource definition api of kubernetes.
let's create a custom resource called CronTab
kubectl apply -f - << EOF
apiVersion: apiextensions.k8s.io/v1
kind: CustomResourceDefinition
metadata:
  # name must match the spec fields below, and be in the form: <plural>.<group>
  name: crontabs.stable.example.com
spec:
  # group name to use for REST API: /apis/<group>/<version>
  group: stable.example.com
  # list of versions supported by this CustomResourceDefinition
  versions:
    - name: v1
      # Each version can be enabled/disabled by Served flag.
      served: true
      # One and only one version must be marked as the storage version.
      storage: true
      schema:
        openAPIV3Schema:
          type: object
          properties:
            spec:
              type: object
              properties:
                cronSpec:
                  type: string
                image:
                  type: string
                replicas:
                  type: integer

      additionalPrinterColumns:
        - name: Spec
        type: string
        description: The cron spec defining the interval a CronJob is run
        jsonPath: .spec.cronSpec
        - name: Replicas
        type: integer
        description: The number of jobs launched by the CronJob
        jsonPath: .spec.replicas
        - name: Age
        type: date
        jsonPath: .metadata.creationTimestamp
  # either Namespaced or Cluster
  scope: Namespaced
  names:
    # plural name to be used in the URL: /apis/<group>/<version>/<plural>
    plural: crontabs
    # singular name to be used as an alias on the CLI and for display
    singular: crontab
    # kind is normally the CamelCased singular type. Your resource manifests use this.
    kind: CronTab
    # shortNames allow shorter string to match your resource on the CLI
    shortNames:
    - ct
EOF
now our CronTab resource type is created.
kubectl get crd
A new namespaced RESTful API endpoint is created at:
/apis/stable.example.com/v1/namespaces/*/crontabs/...
Let's verify the k8s api extension by looking at the api server logs:
kubectl -n kube-system logs -f kube-apiserver-kind-control-plane | grep example.com
Now we can create custom objects of our new custom resource defintion.
In the following example, the cronSpec and image custom fields are set in a custom object of kind CronTab. The kind CronTab comes from the spec of the CustomResourceDefinition object you created above.
kubectl apply -f - << EOF
apiVersion: "stable.example.com/v1"
kind: CronTab
metadata:
  name: my-new-cron-object
spec:
  cronSpec: "* * * * */5"
  image: my-awesome-cron-image
EOF
kubectl get crontab
Let's see how our object is being persisted at the etcd database of k8s.
kubectl exec etcd-kind-control-plane -n kube-system -- sh -c "ETCDCTL_API=3 etcdctl --cacert /etc/kubernetes/pki/etcd/ca.crt  --key /etc/kubernetes/pki/etcd/server.key --cert  /etc/kubernetes/pki/etcd/server.crt  get / --prefix --keys-only" | grep example.com

kubectl exec etcd-kind-control-plane -n kube-system -- sh -c "ETCDCTL_API=3 etcdctl --cacert /etc/kubernetes/pki/etcd/ca.crt  --key /etc/kubernetes/pki/etcd/server.key --cert  /etc/kubernetes/pki/etcd/server.crt  get /registry/apiextensions.k8s.io/customresourcedefinitions/crontabs.stable.example.com --prefix -w json" | jq ".kvs[0].value" | cut -d '"' -f2 | base64 --decode | yq > crd.yml

kubectl exec etcd-kind-control-plane -n kube-system -- sh -c "ETCDCTL_API=3 etcdctl --cacert /etc/kubernetes/pki/etcd/ca.crt  --key /etc/kubernetes/pki/etcd/server.key --cert  /etc/kubernetes/pki/etcd/server.crt  get /registry/apiregistration.k8s.io/apiservices/v1.stable.example.com --prefix -w json" | jq ".kvs[0].value" | cut -d '"' -f2 | base64 --decode | yq > api-registration.yml

kubectl exec etcd-kind-control-plane -n kube-system -- sh -c "ETCDCTL_API=3 etcdctl --cacert /etc/kubernetes/pki/etcd/ca.crt  --key /etc/kubernetes/pki/etcd/server.key --cert  /etc/kubernetes/pki/etcd/server.crt  get /registry/stable.example.com/crontabs/default/my-new-cron-object --prefix -w json" | jq ".kvs[0].value" | cut -d '"' -f2 | base64 --decode | yq > mycron.yml
Delete custom resource
kubectl delete CronTab my-new-cron-object
2. Install Kubebuilder and Create a New Project
let's start by installing kubebuilder
# download kubebuilder and install locally.
curl -L -o kubebuilder "https://go.kubebuilder.io/dl/latest/$(go env GOOS)/$(go env GOARCH)"
chmod +x kubebuilder && mv kubebuilder /usr/local/bin/
let's scaffold a kubebuilder application
mkdir operator-tutorial
cd operator-tutorial
kubebuilder init --repo example.com
let's have a closer look at the make file first. make targets are the commands that are used for different development lifecycle steps
make help
to run your kubebuilder application locally
make run
now let's have a look at the run target and all the prerequisite comamnds that need to run
it looks something like this
.PHONY: run
run: manifests generate fmt vet ## Run a controller from your host.
	go run ./cmd/main.go
so the targets that need to run before we can run our applications are
manifestsandgeneratewhich both have controller-gen as prerequisite and generate some golang code and yaml manifests- the code is formatted by
fmt- validated by
vetrunwill run the go application by refering to the application entrypoint at ./cmd/main.go
3. Create Our First API
Let's imagine we are a working at company where our colleagues are heavy users of the ghost blogging application.
Our job is to provide them with ghost instances whenever and whereever they want it. We are infra gurus and through years of
experience have learned that building an automation for such a task can save us a lot of toil and manual labor.
Our operator will take care of the following:
- create a new instance of the ghost application as a website in our cluster if our cluster doesn't have it already
- update our ghost application when our ghost application custom resource is updated.
- delete the ghost application upon request
Kubebuilder provides a command that allows us to create a custom resource and a process that keeps maintaing (reconciling) that resouce.
If we choose to create a new resouces (let's call it Ghost) kubebuilder will create a blog controller for it automatically.
If we want to attach our own controllers to the exisiting k8s resources say Pods that's posssible too! :D
kubebuilder create api \
  --kind Ghost \
  --group blog \
  --version v1 \
  --resource true \
  --controller true
At this stage, Kubebuilder has wired up two key components for your operator:
A Resource in the form of a Custom Resource Definition (CRD) with the kind Ghost.
A Controller that runs each time a Ghost CRD is create, changed, or deleted.
The command we ran added a Golang representation of the Ghost Custom Resource Definition (CRD) to our operator scaffolding code.
To view this code, navigate to your Code editor tab under api > v1 > ghost_types.go.
Let's have a look at the type GhostSpec struct.
This is the code definition of the Kubernetes object spec. This spec contains a field named foo which is defined in api/v1/ghost_types.go:32.
There is even a helpful comment above the field describing the use of foo.
now let's see how kubebuilder can generate a yaml file for our Custom Resource Definition
make manifests
you will find the generated crd at config/crd/bases/blog.example.com_ghosts.yaml
see how kubebuilder did all the heavylifting we had to previously do for the crontab example! lovely!
let's notice the difference by looking at our kubernetes crds
kubectl get crds
now let's install the crd we generated onto the cluster
make install
and run the get the crds again
kubectl get crds
4. A look into kubebuilder setup
When you selected to create a operator along with the Ghost Resource, Kubebuilder took care of some key setup:
- Starts the operator process during application boot
- Implements a custom Reconcile function to run on each
Ghostresource event - Configures the operator to know which resource events to listen to
To see the start process, navigate to cmd/main.go:125. You will see a section that starts the ghost operator:
if err = (&controllers.WebsiteReconciler{
  Client: mgr.GetClient(),
  Scheme: mgr.GetScheme(),
}).SetupWithManager(mgr); err != nil {
  setupLog.Error(err, "unable to create controller", "controller", "Website")
  os.Exit(1)
}
This is a call to the function SetupWithManager(mgr) defined in the file internal/controller/ghost_controller.go.
Navigate to internal/controller/ghost_controller.go:58 to view this function.
It is already configured to know about the CRD api/v1/ghost_types.go or the generated yaml represenation at crd/bases/blog.example.com_ghosts.
The most important function inside the controller is the Reconcile function internal/controller/ghost_controller.go:49. Reconcile is part of the main kubernetes reconciliation loop which aims to move the current state of the cluster closer to the desired state. It is triggered anytime we change the cluster state related to our custom resource internal/controller/ghost_controller.go:49.
5. Add Some Logging to the Reconcile Function
let's add some logs to the reconcile function and run the operator application and change the state of the cluster.
let's paste this code into the Reconcile function.
log := log.FromContext(ctx)
log.Info("Reconciling Ghost")
log.Info("Reconciliation complete")
return ctrl.Result{}, nil
and run the application
make run
next we need to modify the generated custom resource yaml file
navigate to config/samples/blog_v1_ghost.yaml
and add a foo: bar under spec. The custom resource should look like
apiVersion: blog.example.com/v1
kind: Ghost
metadata:
  name: ghost-sample
spec:
  foo: bar
don't forget to save the file. Now in other terminal window, let's apply it on the cluster.
kubectl apply -f config/samples/blog_v1_ghost.yaml
Tada! checkout the logs showing up!
INFO    Reconciling Ghost
INFO    Reconciliation complete
now let's try deleting the resource.
kubectl delete -f config/samples/blog_v1_ghost.yaml
Same logs showed up again. So basically anytime you interact with your Ghost resource a new event is triggered and your controller will print the logs.
6. Implement the Desired State of the Ghost Operator
Now let us replace the default GhostSpec with a meaningful declartion of our desired state. Meaning we want our custom resource reflect the desired state for our Ghost application.
replace GhostSpec api/v1/ghost_types.go:27 with the following snippet
type GhostSpec struct {
	//+kubebuilder:validation:Pattern=`^[-a-z0-9]*$`
	ImageTag string `json:"imageTag"`
}
This code has three key parts:
//+kubebuilder is a comment prefix that will trigger kubebuilder generation changes. In this case, it will set a validation of the ImageTag value to only allow dashes, lowercase letters, or digits.
The ImageTag is the Golang variable used throughout the codebase. Golang uses capitalized public variable names by convention.
json:"imageTag" defines a "tag" that Kubebuilder uses to generate the YAML field. Yaml parameters starts with lower case variable names by convention.
If omitempty is used in a json tag, that field will be marked as optional, otherwise as mandatory.
Before we generete the new crd and install them on the cluster let's do the following, let's have a look at the existing crd
kubectl get crd ghosts.blog.example.com --output jsonpath="{.spec.versions[0].schema['openAPIV3Schema'].properties.spec.properties}{\"\n\"}" | jq
the output should be like
{
  "foo": {
    "description": "Foo is an example field of Ghost. Edit ghost_types.go to remove/update",
    "type": "string"
  }
}
now, let us install the new crd
make install
and see the changes
kubectl get crd ghosts.blog.example.com --output jsonpath="{.spec.versions[0].schema['openAPIV3Schema'].properties.spec.properties}{\"\n\"}" | jq
the output should be
{
  "imageTag": {
    "pattern": "^[-a-z0-9]*$",
    "type": "string"
  }
}
7. Access the Custom Resource Inside the Reconcile Function
now let's try to access our custom resource in the reconcile function.
first off, let us reflect our new fields in our cutom resource.
let us replace config/samples/blog_v1_ghost.yaml with the following
apiVersion: blog.example.com/v1
kind: Ghost
metadata:
  name: ghost-sample
  namespace: marketing
spec:
  imageTag: latest
kubectl create namespace marketing
kubectl apply -f config/samples/blog_v1_ghost.yaml
next, let us replace the reconcile code with the following snippet:
log := log.FromContext(ctx)
ghost := &blogv1.Ghost{}
if err := r.Get(ctx, req.NamespacedName, ghost); err != nil {
  log.Error(err, "Failed to get Ghost")
  return ctrl.Result{}, client.IgnoreNotFound(err)
}

log.Info("Reconciling Ghost", "imageTag", ghost.Spec.ImageTag, "team", ghost.ObjectMeta.Namespace)
log.Info("Reconciliation complete")
return ctrl.Result{}, nil
let us anlyze the above snippet line by line.
line 1 assings a logger instance to the variable log variable.
line 2 creates an instance of our Ghost data structure.
line 3 tries to read a ghost instance from the reconciler client. Please note that the r which is a reference to the GhostReconciler has a k8s client interface and that interface which implements the Get method which is an equivalent golang implementation of the kubectl get. on succesful Get the resouce will be written to our ghost variable. in case of error, client logs the error. if the error is of type (not found) the controller won't return an error. error not found will happen if we run kubectl delete -f config/samples/blog_v1_ghost.yaml
now we can start our application again:
make run
so far our reconcile function is not run yet but if we apply our custom resource in another terminal window:
kubectl apply -f config/crd/samples/blog_v1_ghost.yaml
we start to see the logs of our reconcile function
INFO    Reconciling Ghost       {"controller": "ghost", "controllerGroup": "blog.example.com", "controllerKind": "Ghost", "Ghost": {"name":"ghost-sample","namespace":"marketing"}, "namespace": "marketing", "name": "ghost-sample", "reconcileID": "9faf1c4f-6dcf-42d5-9f16-fbebb453b4ed", "imageTag": "latest", "team": "marketing"}
2024-04-29T15:54:05+02:00

INFO    Reconciliation complete {"controller": "ghost", "controllerGroup": "blog.example.com", "controllerKind": "Ghost", "Ghost": {"name":"ghost-sample","namespace":"marketing"}, "namespace": "marketing", "name": "ghost-sample", "reconcileID": "9faf1c4f-6dcf-42d5-9f16-fbebb453b4ed"}
cool! next stop, we will implement the actual controller logic for our ghost operator.
8. Implement the Ghost Operator Logic, Part 1 - PVC
Before we start coding the ghost operator, we need to know what resources we need in order to deploy ghost to our cluster. let's consult the docker hub page for ghost. https://hub.docker.com/_/ghost
As we would like to persist ghost data to a persistent volume, we can try to convert this docker command to a k8s deployment.
docker run -d \
	--name some-ghost \
	-e NODE_ENV=development \
	-e database__connection__filename='/var/lib/ghost/content/data/ghost.db' \
	-p 3001:2368 \
	-v some-ghost-data:/var/lib/ghost/content \
	ghost:alpine
The deployment would look something like
apiVersion: apps/v1
kind: Deployment
metadata:
  name: ghost-deployment
spec:
  replicas: 1 # You can adjust the number of replicas as needed
  selector:
    matchLabels:
      app: ghost
  template:
    metadata:
      labels:
        app: ghost
    spec:
      containers:
      - name: ghost
        image: ghost:alpine
        env:
        - name: NODE_ENV
          value: development
        - name: database__connection__filename
          value: /var/lib/ghost/content/data/ghost.db
        ports:
        - containerPort: 2368
        volumeMounts:
        - name: ghost-data
          mountPath: /var/lib/ghost/content
      volumes:
      - name: ghost-data
        persistentVolumeClaim:
          claimName: ghost-data-pvc # Define your PVC or use an existing one
As you can see this deployment expects an existing persistent volume claim called ghost-data-pvc
We can define it with this yaml:
apiVersion: v1
kind: PersistentVolumeClaim
metadata:
  name: ghost-data-pvc
spec:
  accessModes:
    - ReadWriteOnce
  resources:
    requests:
      storage: 1Gi
In our operator, each team's ghost instance will be deployed to the team's corresponding namespace.
Let us try to code the pvc provisiong into our controller. For that we need to copy the following snippet to our controller.
internal/controller/ghost_controller.go
func (r *GhostReconciler) addPvcIfNotExists(ctx context.Context, ghost *blogv1.Ghost) error {
	log := log.FromContext(ctx)

	pvc := &corev1.PersistentVolumeClaim{}
	team := ghost.ObjectMeta.Namespace
	pvcName := pvcNamePrefix + team

	err := r.Get(ctx, client.ObjectKey{Namespace: ghost.ObjectMeta.Namespace, Name: pvcName}, pvc)

	if err == nil {
		// PVC exists, we are done here!
		return nil
	}

	// PVC does not exist, create it
	desiredPVC := generateDesiredPVC(ghost, pvcName)
	if err := controllerutil.SetControllerReference(ghost, desiredPVC, r.Scheme); err != nil {
		return err
	}

	if err := r.Create(ctx, desiredPVC); err != nil {
		return err
	}
	r.recoder.Event(ghost, corev1.EventTypeNormal, "PVCReady", "PVC created successfully")
	log.Info("PVC created", "pvc", pvcName)
	return nil
}

func generateDesiredPVC(ghost *blogv1.Ghost, pvcName string) *corev1.PersistentVolumeClaim {
	return &corev1.PersistentVolumeClaim{
		ObjectMeta: metav1.ObjectMeta{
			Name:      pvcName,
			Namespace: ghost.ObjectMeta.Namespace,
		},
		Spec: corev1.PersistentVolumeClaimSpec{
			AccessModes: []corev1.PersistentVolumeAccessMode{corev1.ReadWriteOnce},
			Resources: corev1.VolumeResourceRequirements{
				Requests: corev1.ResourceList{
					corev1.ResourceStorage: resource.MustParse("1Gi"),
				},
			},
		},
	}
}
Let's make sure we have the following import statements in the import section of our controller internal/controller/ghost_controller.go.
corev1 "k8s.io/api/core/v1"
metav1 "k8s.io/apimachinery/pkg/apis/meta/v1"
"k8s.io/apimachinery/pkg/api/resource"
"sigs.k8s.io/controller-runtime/pkg/controller/controllerutil"
"k8s.io/client-go/tools/record"
Also let's replace our GhostReconciler struct with the following snippet
type GhostReconciler struct {
	client.Client
	Scheme  *runtime.Scheme
	recoder record.EventRecorder
}
and Let's add
const pvcNamePrefix = "ghost-data-pvc-"
const deploymentNamePrefix = "ghost-deployment-"
const svcNamePrefix = "ghost-service-"
right after our GhostReconciler struct. (around line 40).
And add this line as the first line of the SetupWithManager function.
r.recoder = mgr.GetEventRecorderFor("ghost-controller")
The addPvcIfNotExists function, checks whether the pvc is already created and if not, it will create it in the right namespace.
let's rebuild the application to make sure there are no syntax errors.
make
9. Implement the Ghost Operator Logic, Part 2 - RBAC
Next, we need to specify the kubebuilder markers for RBAC. After we created our apis there are 3 markers generated by default.
//+kubebuilder:rbac:groups=blog.example.com,resources=ghosts,verbs=get;list;watch;create;update;patch;delete
//+kubebuilder:rbac:groups=blog.example.com,resources=ghosts/status,verbs=get;update;patch
//+kubebuilder:rbac:groups=blog.example.com,resources=ghosts/finalizers,verbs=update
These markers with //+kubebuilder prefix are picked up by make manfists where a ClusterRole manifests is generated and assiged to the operator manager application. When we CRUD other APIs such as deployment, services and Persistent Volume Claims, we need to add those related markers, otherwise our operator will be unauthorized to perform those operations. In case of our operator, we need to additional markers right below the default ones at internal/controller/ghost_controller.go.
//+kubebuilder:rbac:groups=blog.example.com,resources=ghosts/events,verbs=get;list;watch;create;update;patch
//+kubebuilder:rbac:groups="",resources=persistentvolumeclaims,verbs=get;list;watch;create;update;patch;delete
//+kubebuilder:rbac:groups=apps,resources=deployments,verbs=get;list;watch;create;update;patch;delete
//+kubebuilder:rbac:groups="",resources=services,verbs=get;list;watch;create;update;patch;delete
Please note the first one, is needed when we later introduce a function to persist operator events in the ghost resource. To generate RBAC manfiests, we can run
make manifests
The generated manifest for the manager cluster role, will be generated at config/rbac/role.yaml
10. Implement the Ghost Operator Logic, Part 3 - Deployment
Next, we add the deployment create and update logic to our controller. For that we copy the following snippet to our controller.
The logic is very similar to the previous snippet. However there is one key difference and that is that addOrUpdateDeployment can also update a deployment in case the deployed imageTag for the ghost image is different from the one coming from the ghost.Spec aka. desired state.
func (r *GhostReconciler) addOrUpdateDeployment(ctx context.Context, ghost *blogv1.Ghost) error {
	log := log.FromContext(ctx)
	deploymentList := &appsv1.DeploymentList{}
	labelSelector := labels.Set{"app": "ghost-" + ghost.ObjectMeta.Namespace}

	err := r.List(ctx, deploymentList, &client.ListOptions{
		Namespace:     ghost.ObjectMeta.Namespace,
		LabelSelector: labelSelector.AsSelector(),
	})
	if err != nil {
		return err
	}

	if len(deploymentList.Items) > 0 {
		// Deployment exists, update it
		existingDeployment := &deploymentList.Items[0] // Assuming only one deployment exists
		desiredDeployment := generateDesiredDeployment(ghost)

		// Compare relevant fields to determine if an update is needed
		if existingDeployment.Spec.Template.Spec.Containers[0].Image != desiredDeployment.Spec.Template.Spec.Containers[0].Image {
			// Fields have changed, update the deployment
			existingDeployment.Spec = desiredDeployment.Spec
			if err := r.Update(ctx, existingDeployment); err != nil {
				return err
			}
			log.Info("Deployment updated", "deployment", existingDeployment.Name)
			r.recoder.Event(ghost, corev1.EventTypeNormal, "DeploymentUpdated", "Deployment updated successfully")
		} else {
			log.Info("Deployment is up to date, no action required", "deployment", existingDeployment.Name)
		}
		return nil
	}

	// Deployment does not exist, create it
	desiredDeployment := generateDesiredDeployment(ghost)
	if err := controllerutil.SetControllerReference(ghost, desiredDeployment, r.Scheme); err != nil {
		return err
	}
	if err := r.Create(ctx, desiredDeployment); err != nil {
		return err
	}
	r.recoder.Event(ghost, corev1.EventTypeNormal, "DeploymentCreated", "Deployment created successfully")
	log.Info("Deployment created", "team", ghost.ObjectMeta.Namespace)
	return nil
}

func generateDesiredDeployment(ghost *blogv1.Ghost) *appsv1.Deployment {
	replicas := int32(1) // Adjust replica count as needed
	return &appsv1.Deployment{
		ObjectMeta: metav1.ObjectMeta{
			GenerateName: deploymentNamePrefix,
			Namespace:    ghost.ObjectMeta.Namespace,
			Labels: map[string]string{
				"app": "ghost-" + ghost.ObjectMeta.Namespace,
			},
		},
		Spec: appsv1.DeploymentSpec{
			Replicas: &replicas,
			Selector: &metav1.LabelSelector{
				MatchLabels: map[string]string{
					"app": "ghost-" + ghost.ObjectMeta.Namespace,
				},
			},
			Template: corev1.PodTemplateSpec{
				ObjectMeta: metav1.ObjectMeta{
					Labels: map[string]string{
						"app": "ghost-" + ghost.ObjectMeta.Namespace,
					},
				},
				Spec: corev1.PodSpec{
					Containers: []corev1.Container{
						{
							Name:  "ghost",
							Image: "ghost:" + ghost.Spec.ImageTag,
							Env: []corev1.EnvVar{
								{
									Name:  "NODE_ENV",
									Value: "development",
								},
								{
									Name:  "database__connection__filename",
									Value: "/var/lib/ghost/content/data/ghost.db",
								},
							},
							Ports: []corev1.ContainerPort{
								{
									ContainerPort: 2368,
								},
							},
							VolumeMounts: []corev1.VolumeMount{
								{
									Name:      "ghost-data",
									MountPath: "/var/lib/ghost/content",
								},
							},
						},
					},
					Volumes: []corev1.Volume{
						{
							Name: "ghost-data",
							VolumeSource: corev1.VolumeSource{
								PersistentVolumeClaim: &corev1.PersistentVolumeClaimVolumeSource{
									ClaimName: "ghost-data-pvc-" + ghost.ObjectMeta.Namespace,
								},
							},
						},
					},
				},
			},
		},
	}
}
Let's make sure apps/v1 import statement is added to the import section.
appsv1 "k8s.io/api/apps/v1"
11. Implement the Ghost Operator Logic, Part 4 - Service
And Lastly we need to add a service for our deployment. For now let's choose a service of type NodePort
apiVersion: v1
kind: Service
metadata:
  name: ghost-service
spec:
  type: NodePort
  ports:
    - port: 80 # Exposed port on the service
      targetPort: 2368 # Port your application is listening on inside the pod
      nodePort: 30001 # NodePort to access the service externally
  selector:
    app: ghost
Next, we need to implement a go funtion that creates such service for us.
func (r *GhostReconciler) addServiceIfNotExists(ctx context.Context, ghost *blogv1.Ghost) error {
	log := log.FromContext(ctx)
	service := &corev1.Service{}
	err := r.Get(ctx, client.ObjectKey{Namespace: ghost.ObjectMeta.Namespace, Name: svcNamePrefix + ghost.ObjectMeta.Namespace}, service)
	if err != nil && client.IgnoreNotFound(err) != nil {
		return err
	}

	if err == nil {
		// Service exists
		return nil
	}
	// Service does not exist, create it
	desiredService := generateDesiredService(ghost)
	if err := controllerutil.SetControllerReference(ghost, desiredService, r.Scheme); err != nil {
		return err
	}

	// Service does not exist, create it
	if err := r.Create(ctx, desiredService); err != nil {
		return err
	}
	r.recoder.Event(ghost, corev1.EventTypeNormal, "ServiceCreated", "Service created successfully")
	log.Info("Service created", "service", desiredService.Name)
	return nil
}

func generateDesiredService(ghost *blogv1.Ghost) *corev1.Service {
	return &corev1.Service{
		ObjectMeta: metav1.ObjectMeta{
			Name:      "ghost-service-" + ghost.ObjectMeta.Namespace,
			Namespace: ghost.ObjectMeta.Namespace,
		},
		Spec: corev1.ServiceSpec{
			Type: corev1.ServiceTypeNodePort,
			Ports: []corev1.ServicePort{
				{
					Port:       80,
					TargetPort: intstr.FromInt(2368),
					NodePort:   30001,
				},
			},
			Selector: map[string]string{
				"app": "ghost-" + ghost.ObjectMeta.Namespace,
			},
		},
	}
}
12. Implement the Final Logic of the Reconcile Function
Next we need to call our function in our reconcile function. We start by calling the functions we added one by one.
In case there is an error we update the status of our ghost deployment. For that, we need to make a couple of adjustments first.
First we replace GhostStatus in api/v1/ghost_types.go with the following
type GhostStatus struct {
    Conditions []metav1.Condition `json:"conditions,omitempty"`
}
and we add two helper functions to our controller. internal/controller/ghost_controller.go
// Function to add a condition to the GhostStatus
func addCondition(status *blogv1.GhostStatus, condType string, statusType metav1.ConditionStatus, reason, message string) {
	for i, existingCondition := range status.Conditions {
		if existingCondition.Type == condType {
			// Condition already exists, update it
			status.Conditions[i].Status = statusType
			status.Conditions[i].Reason = reason
			status.Conditions[i].Message = message
			status.Conditions[i].LastTransitionTime = metav1.Now()
			return
		}
	}

	// Condition does not exist, add it
	condition := metav1.Condition{
		Type:               condType,
		Status:             statusType,
		Reason:             reason,
		Message:            message,
		LastTransitionTime: metav1.Now(),
	}
	status.Conditions = append(status.Conditions, condition)
}

// Function to update the status of the Ghost object
func (r *GhostReconciler) updateStatus(ctx context.Context, ghost *blogv1.Ghost) error {
	// Update the status of the Ghost object
	if err := r.Status().Update(ctx, ghost); err != nil {
		return err
	}

	return nil
}
And finally our reconcile function should be replaced with the following snippet.
func (r *GhostReconciler) Reconcile(ctx context.Context, req ctrl.Request) (ctrl.Result, error) {
	log := log.FromContext(ctx)
	ghost := &blogv1.Ghost{}
	if err := r.Get(ctx, req.NamespacedName, ghost); err != nil {
		log.Error(err, "Failed to get Ghost")
		return ctrl.Result{}, client.IgnoreNotFound(err)
	}
	// Initialize completion status flags
	// Add or update the namespace first
	pvcReady := false
	deploymentReady := false
	serviceReady := false
	log.Info("Reconciling Ghost", "imageTag", ghost.Spec.ImageTag, "team", ghost.ObjectMeta.Namespace)
	// Add or update PVC
	if err := r.addPvcIfNotExists(ctx, ghost); err != nil {
		log.Error(err, "Failed to add PVC for Ghost")
		addCondition(&ghost.Status, "PVCNotReady", metav1.ConditionFalse, "PVCNotReady", "Failed to add PVC for Ghost")
		return ctrl.Result{}, err
	} else {
		pvcReady = true
	}
	// Add or update Deployment
	if err := r.addOrUpdateDeployment(ctx, ghost); err != nil {
		log.Error(err, "Failed to add or update Deployment for Ghost")
		addCondition(&ghost.Status, "DeploymentNotReady", metav1.ConditionFalse, "DeploymentNotReady", "Failed to add or update Deployment for Ghost")
		return ctrl.Result{}, err
	} else {
		deploymentReady = true
	}
	// Add or update Service
	if err := r.addServiceIfNotExists(ctx, ghost); err != nil {
		log.Error(err, "Failed to add Service for Ghost")
		addCondition(&ghost.Status, "ServiceNotReady", metav1.ConditionFalse, "ServiceNotReady", "Failed to add Service for Ghost")
		return ctrl.Result{}, err
	} else {
		serviceReady = true
	}
	// Check if all subresources are ready
	if pvcReady && deploymentReady && serviceReady {
		// Add your desired condition when all subresources are ready
		addCondition(&ghost.Status, "GhostReady", metav1.ConditionTrue, "AllSubresourcesReady", "All subresources are ready")
	}
	log.Info("Reconciliation complete")
	if err := r.updateStatus(ctx, ghost); err != nil {
		log.Error(err, "Failed to update Ghost status")
		return ctrl.Result{}, err
	}

	return ctrl.Result{}, nil
}
now, let us run our operator application. before we do that let's make sure we are starting from scratch.
kubectl delete namespace marketing
make run
we can see the logs and see that our operator application is up and running, in another terminal we create a ghost resource.
kubectl create namespace marketing
kubectl apply -f config/samples/blog_v1_ghost.yaml
We start to see our reconciliation logs showing up and our subresources being created. We can inspect them by running k9s.
We can perform a portforward on the service to see our ghost application in a browser.
Let's have a look at our ghost resource as well.
kubectl describe -n marketing ghosts.blog.example.com ghost-sample
13. Update the Ghost Resource
let us perform an update on our resource and use the alpine image tag instead of latest.
So, let us replace config/samples/blog_v1_ghost.yaml with the following and apply it.
apiVersion: blog.example.com/v1
kind: Ghost
metadata:
  name: ghost-sample
  namespace: marketing
spec:
  imageTag: alpine
kubectl apply -f config/samples/blog_v1_ghost.yaml
We can see that our deployment subresource is being updated and the update logs are showing up in the console. We can confirm this by inspecting the deployment in k9s.
14. Deleting the ghost resource
If we perform a delete operation on our resource, all the subresouces will be deleted too, as we set their owner to be the ghost resource.
Please notice the controllerutil.SetControllerReference usage, before creating the subresources.
Let us perform the delete and see the effect.
kubectl delete ghosts.blog.example.com -n marketing ghost-sample
We can see all the subresources are deleted.
kubectl get all -n marketing
15. Deploy Ghost Operator to the Cluster
Your operator is an application, so it needs to be packaged as a OCI compliant container image just like any other container you want to deploy.
We need to run the right make command to build our OCI image and then Deploy it.
Build
# please use your own tag here! :D
export IMG=c8n.io/aghilish/ghost-operator:latest
make docker-build
Push
make docker-push
Deploy
make deploy
Undeploy
make undeploy
And we can look around and inspect the logs of our manager when we CRUD operations with our ghost API.
kubectl get all -n ghost-operator-system
16. [Bonus] Setup VSCode Debugger
Being able to run our operator application in debug mode is definitely a nice thing.
Fortutanly we can simply do this on vscode. Let's click on the create a launch.json file in the Run and Debug.
Next we select Go and Go Launch Package. In the generated json file we need to adjust the program argument and set it to the
main.go file of our application which is at cmd/main.go.
{
    // Use IntelliSense to learn about possible attributes.
    // Hover to view descriptions of existing attributes.
    // For more information, visit: https://go.microsoft.com/fwlink/?linkid=830387
    "version": "0.2.0",
    "configurations": [
        {
            "name": "Launch Package",
            "type": "go",
            "request": "launch",
            "mode": "auto",
            "program": "${fileDirname}/cmd/main.go"
        }
    ]
}
Kubernetes Webhooks
Links
Learning Resources
What are Admission Controllers
An admission controller is a piece of code that intercepts requests to the Kubernetes API server prior to persistence of the object, but after the request is authenticated and authorized. Admission controllers may be validating, mutating, or both. Mutating controllers may modify objects related to the requests they admit; validating controllers may not. Admission controllers limit requests to create, delete, modify objects. Admission controllers do not (and cannot) block requests to read (get, watch or list) objects.
The admission controllers in Kubernetes 1.30 consist of the list below, are compiled into the kube-apiserver binary, and may only be configured by the cluster administrator.
Why do we need them ?
Why do I need them? Several important features of Kubernetes require an admission controller to be enabled in order to properly support the feature. As a result, a Kubernetes API server that is not properly configured with the right set of admission controllers is an incomplete server and will not support all the features you expect.
How can we turn them on ?
kube-apiserver --enable-admission-plugins=NamespaceLifecycle,LimitRanger ...
Which ones are enabled by default ?
# to get the list we can run
kube-apiserver -h | grep enable-admission-plugins
# these are enabled by default

#CertificateApproval, CertificateSigning, CertificateSubjectRestriction, DefaultIngressClass, DefaultStorageClass, DefaultTolerationSeconds, LimitRanger, MutatingAdmissionWebhook, NamespaceLifecycle, PersistentVolumeClaimResize, PodSecurity, Priority, ResourceQuota, RuntimeClass, ServiceAccount, StorageObjectInUseProtection, TaintNodesByCondition, ValidatingAdmissionPolicy, ValidatingAdmissionWebhook
Dynamic Admission Control
In addition to compiled-in admission plugins, admission plugins can be developed as extensions and run as webhooks configured at runtime. This page describes how to build, configure, use, and monitor admission webhooks.
What are Admission Webhooks
Admission webhooks are HTTP callbacks that receive admission requests and do something with them. You can define two types of admission webhooks, validating admission webhook and mutating admission webhook. Mutating admission webhooks are invoked first, and can modify objects sent to the API server to enforce custom defaults. After all object modifications are complete, and after the incoming object is validated by the API server, validating admission webhooks are invoked and can reject requests to enforce custom policies.
Create a figure for admission webhook request (admission review) Create a figure for admission webhook response (admission review) Admission Webhooks can run inside or outside the cluster. If We deploy them inside the cluster, we can leverage cert manager for automatically inject certificate
Dynamic Admission Control Details

1. Create a Webhook for Our Operator
We need a test cluster. Kind is a good option.
kind create cluster
let's pick up where we left off last time by cloning our ghost operator tutorial.
git clone https://github.com/aghilish/operator-tutorial.git
cd operator-tutorial
let's create our first webhook
kubebuilder create webhook --kind Ghost --group blog --version v1 --defaulting --programmatic-validation
Let's have a look at the api/v1/ghost_webhook.go file, you should notice that some boilerplate code was generated for us to implement Mutating and Validating webhook logic.
Next we are gonna add a new field to our ghost spec called replicas. As you might have guessed this field is there to set the number of replicas on the managed deployment resource which we set on our ghost resource.
ok let's add the following line to our GhostSpec struct api/v1/ghost_types.go:30.
//+kubebuilder:validation:Minimum=1
Replicas int32 `json:"replicas"`
Please note the kubebuilder marker. It validates the replicas value to be at least 1. But it's an optional value.
This validation marker will then translate into our custom resource definition. This type of validation is called declarartive validation.
With Validating Admission Webhooks we can validate our resources in a programmatic way meaning the webhook can return errors with custome messages if programmatic validation fails. In our Mutating Validation Webhook we can mutate our resource or set a default for replias if nothing is set on the custom resource manifest.
2. Update Controller
Before we implement the validation logic let us handle the new replicas field in our controller.
let's render new manifests first
make manifests
Now are CRD is updated.
and update our controller as follows.
Update generateDesiredDeployment at internal/controller/ghost_controller.go:243
with the following
replicas := ghost.Spec.Replicas
and the update condition at addOrUpdateDeployment at internal/controller/ghost_controller.go:243
existingDeployment.Spec.Template.Spec.Containers[0].Image != desiredDeployment.Spec.Template.Spec.Containers[0].Image ||
			*existingDeployment.Spec.Replicas != *desiredDeployment.Spec.Replicas
and let's make sure we don't have any build error by running
make
3. Implement Webhook Logic
Next we are gonna add a defaulting and validating logic to our admission webhook. If the replicas is set to 0 we set it to 2 and if during create or update the replicas is set to a value bigger than 5 the validation fails. let's replace the content of our webhook at api/v1/ghost_webhook.go with the following.
package v1

import (
	"fmt"

	"k8s.io/apimachinery/pkg/runtime"
	ctrl "sigs.k8s.io/controller-runtime"
	logf "sigs.k8s.io/controller-runtime/pkg/log"
	"sigs.k8s.io/controller-runtime/pkg/webhook"
	"sigs.k8s.io/controller-runtime/pkg/webhook/admission"
)

// log is for logging in this package.
var ghostlog = logf.Log.WithName("ghost-resource")

// SetupWebhookWithManager will setup the manager to manage the webhooks
func (r *Ghost) SetupWebhookWithManager(mgr ctrl.Manager) error {
	return ctrl.NewWebhookManagedBy(mgr).
		For(r).
		Complete()
}

// TODO(user): EDIT THIS FILE!  THIS IS SCAFFOLDING FOR YOU TO OWN!

//+kubebuilder:webhook:path=/mutate-blog-example-com-v1-ghost,mutating=true,failurePolicy=fail,sideEffects=None,groups=blog.example.com,resources=ghosts,verbs=create;update,versions=v1,name=mghost.kb.io,admissionReviewVersions=v1

var _ webhook.Defaulter = &Ghost{}

// Default implements webhook.Defaulter so a webhook will be registered for the type
func (r *Ghost) Default() {
	ghostlog.Info("default", "name", r.Name)

	if r.Spec.Replicas == 0 {
		r.Spec.Replicas = 2
	}
}

// TODO(user): change verbs to "verbs=create;update;delete" if you want to enable deletion validation.
//+kubebuilder:webhook:path=/validate-blog-example-com-v1-ghost,mutating=false,failurePolicy=fail,sideEffects=None,groups=blog.example.com,resources=ghosts,verbs=create;update,versions=v1,name=vghost.kb.io,admissionReviewVersions=v1

var _ webhook.Validator = &Ghost{}

// ValidateCreate implements webhook.Validator so a webhook will be registered for the type
func (r *Ghost) ValidateCreate() (admission.Warnings, error) {
	ghostlog.Info("validate create", "name", r.Name)
	return validateReplicas(r)
}

// ValidateUpdate implements webhook.Validator so a webhook will be registered for the type
func (r *Ghost) ValidateUpdate(old runtime.Object) (admission.Warnings, error) {
	ghostlog.Info("validate update", "name", r.Name)
	return validateReplicas(r)
}

// ValidateDelete implements webhook.Validator so a webhook will be registered for the type
func (r *Ghost) ValidateDelete() (admission.Warnings, error) {
	ghostlog.Info("validate delete", "name", r.Name)

	// TODO(user): fill in your validation logic upon object deletion.
	return nil, nil
}

func validateReplicas(r *Ghost) (admission.Warnings, error) {
	if r.Spec.Replicas > 5 {
		return nil, fmt.Errorf("ghost replicas cannot be more than 5")
	}
	return nil, nil
}
4. Deploy Webhook
Once our webhook is implemented, all that’s left is to create the WebhookConfiguration manifests required to register our webhooks with Kubernetes. The connection between the kubernetes api and our webhook server needs to be secure and encrypted. This can easily happen if we use certmanager togehter with the powerful scaffolding of kubebuilder.
We need to enable the cert-manager deployment via kubebuilder, in order to do that we should edit config/default/kustomization.yaml and config/crd/kustomization.yaml files by uncommenting the sections marked by [WEBHOOK] and [CERTMANAGER] comments.
We also add a new target to our make file for installing cert-manager using a helm command.
So let's add the following to the botton of our make file.
##@ Helm

HELM_VERSION ?= v3.7.1

.PHONY: helm
helm: ## Download helm locally if necessary.
ifeq (, $(shell which helm))
        @{ \
        set -e ;\
        curl https://raw.githubusercontent.com/helm/helm/main/scripts/get-helm-3 | bash ;\
        }
endif

.PHONY: install-cert-manager
install-cert-manager: helm ## Install cert-manager using Helm.
		helm repo add jetstack https://charts.jetstack.io
		helm repo update
		helm install cert-manager jetstack/cert-manager --namespace cert-manager --create-namespace --version v1.15.0 --set crds.enabled=true

.PHONY: uninstall-cert-manager
uninstall-cert-manager: helm ## Uninstall cert-manager using Helm.
		helm uninstall cert-manager --namespace cert-manager
		kubectl delete namespace cert-manager
cool, now let's instal cert-manage on our cluster:
make install-cert-manager
and get the pods in the cert-manager to make sure they are running
kubectl get pods -n cert-manager
NAME                                       READY   STATUS    RESTARTS   AGE
cert-manager-cainjector-698464d9bb-vq96f   1/1     Running   0          2m
cert-manager-d7db49bf4-q2gkc               1/1     Running   0          2m
cert-manager-webhook-f6c9958d-jwhr2        1/1     Running   0          2m
awesome, now let us build our new controller image and deploy everything (controller and admission webhooks)
to our cluster. Let us bump up our controller image tag to v2.
export IMG=c8n.io/aghilish/ghost-operator:v2
make docker-build
make docker-push
make deploy
and check if our manager is running in the opeator-turorial-system namespace.
kubectl get pods -n operator-tutorial-system
NAME                                                   READY   STATUS    RESTARTS   AGE
operator-tutorial-controller-manager-db8c46dbf-58kdn   2/2     Running   0          2m
and to make sure that our webhook configurations are also deployed. we can run the following
kubectl get mutatingwebhookconfigurations.admissionregistration.k8s.io -n operator-tutorial-system
NAME                                               WEBHOOKS   AGE
cert-manager-webhook                               1          2m
operator-tutorial-mutating-webhook-configuration   1          2m
kubectl get mutatingwebhookconfigurations.admissionregistration.k8s.io -n operator-tutorial-system
NAME                                                 WEBHOOKS   AGE
cert-manager-webhook                                 1          2m
operator-tutorial-validating-webhook-configuration   1          2m
we see our webhook configurations as well as the ones that belong to cert-manager and are in charge of injecting the caBunlde
into our webhook services.
Awesome! everything is deployed. Now let's see if the admission webhook is working as we expect.
5. Test Mutating Webhook
Let's first check the (defaulting)/mutating web hook. let us make sure the marketing namespace exists.
kubectl create namespace marketing
and use the following ghost resource config/samples/blog_v1_ghost.yaml.
apiVersion: blog.example.com/v1
kind: Ghost
metadata:
  name: ghost-sample
  namespace: marketing
spec:
  imageTag: alpine
as you can see the replicas field is not set, therefore the defaulting webhook should
intercept the resource creation and set the replicas to 2 as we defined above.
let us make sure that is the case.
kubectl apply -f config/samples/blog_v1_ghost.yaml
and check the number of replicas on the ghost resouce we see it is set to 2.
kubectl get ghosts.blog.example.com -n marketing ghost-sample -o jsonpath="{.spec.replicas}" | yq
2
let us check the number of replicas (pods) of our ghost deployment managed resource, to confirm that in action.
kubectl get pods -n marketing
NAME                                      READY   STATUS    RESTARTS      AGE
ghost-deployment-68rl2-85b796bd67-hzs6f   1/1     Running   1 			  2m
ghost-deployment-68rl2-85b796bd67-pczwx   1/1     Running   0             2m
Yep!
6. Test Valdating Webhook
Ok, now let us check if the validation webhook is also working as expected.
If you remember from the above, we reject custom resources with replicas > 5.
so let us apply the following resouce with 6 replicas.
apiVersion: blog.example.com/v1
kind: Ghost
metadata:
  name: ghost-sample
  namespace: marketing
spec:
  imageTag: alpine
  replicas: 6
config/samples/blog_v1_ghost.yaml.
kubectl apply -f config/samples/blog_v1_ghost.yaml
yep! and we get
Error from server (Forbidden): error when applying patch:
{"metadata":{"annotations":{"kubectl.kubernetes.io/last-applied-configuration":"{\"apiVersion\":\"blog.example.com/v1\",\"kind\":\"Ghost\",\"metadata\":{\"annotations\":{},\"name\":\"ghost-sample\",\"namespace\":\"marketing\"},\"spec\":{\"imageTag\":\"alpine\",\"replicas\":6}}\n"}},"spec":{"replicas":6}}
to:
Resource: "blog.example.com/v1, Resource=ghosts", GroupVersionKind: "blog.example.com/v1, Kind=Ghost"
Name: "ghost-sample", Namespace: "marketing"
for: "config/samples/blog_v1_ghost.yaml": error when patching "config/samples/blog_v1_ghost.yaml": admission webhook "vghost.kb.io" denied the request: ghost replicas cannot be more than 5
our validation webhook has rejected the admission review with our custom error message in the last line.
ghost replicas cannot be more than 5
Serverless
100Days Resources
- Video by Anais Urlichs
- Add your blog posts, videos etc. related to the topic here!
Learning Resources
TODO
Example Notes
There is no such thing as serverless, there is always a server
How do we think about Serverless?
In the cloud, functions written in JavaScript, response to event/triggers ⇒ highly narrowed view
Why would you want Serverless?
- You want to try out cool things
- You want to stop over- or under-provisioning of your infrastructure
- You want to try out cool things
Serverless
Serverless: Popular operating model — infrastructure requirements are provisioned just before the Serverless workload is executed — The infrastructure resources are just needed during the execution, so there is no need to keep the infrastructure during low to now usage.
The serverless platform will likely run on containers.
- No Server Management is necessary
- You only pay for the execution time
- They can scale to 0 = no costs to keep the infrastructure up
- Serverless functions are stateless, this promotes scalability
- Auto-scalability ⇒ usually taken care of by the cloud provider
- Reduced operational costs
It does not mean that there are no servers involved. Instead it is the process of ensuring that the infrastructure is provisioned automatically. In this case, the developer is less involved to managing infrastructure.
FAAS is a compute platform for your service — they are essentially processing your code. These functions are called by events, events in this case are any trigger.
Within Serverless, cloud providers provision event-driven architecture. When you build your app, you look for those events and you add them to your code.
Issues with serverless
- Functions/processes of your code will not finish before the infrastructure downgrades
- Latency issues i.e. because of cold starts
Moving from IAAS to PAAS to FAAS
Two distinctions
- Not using Servers
- FaaS (Function as a Service): Is essentially small pieces of code that are run in the cloud on stateless containers
One is about hiding operations from us
Serverless options
- Google: Google Cloud Functions
- AWS: Lambda
- For Kubernetes: Knative
What is a cold start?
Serverless functions can be really slow the first time that they start. This can be a problem. These articles offer some comparisons
- https://mikhail.io/serverless/coldstarts/aws/
- https://mikhail.io/serverless/coldstarts/big3/
- Discussion https://youtu.be/AuMeockiuLs
AWS has something called Provisioned Concurrency that allows you to keep on x functions that are always on and ready.
When would you not want to use Serverless:
- When you have a consistent traffic
Be careful,
- Different serverless resources have different pricing models, meaning it could easily happen that you accidentally leave your serverless function running and it will eat up your pocket
- If you depend on a Serverless feature, it is easy to get vendorlocked.
Resources
- How to think about Serverless https://youtu.be/_1-5YFfJCqM
I am going to be looking in the next days at
- Knative: Kubernetes based open source building blocks for serverless
- Faasd: https://github.com/openfaas/faasd
Ingress from scratch
100Days Resources
- Video by Anais Urlichs
- Add your blog posts, videos etc. related to the topic here!
Learning Resources
TODO
Example Notes
If you are new to 100 Days Of Kubernetes, have a look at the previous days to fill in the gaps and fundamentals for today:
Day 11: More exercises on Services
Resources
- Do I need a service mesh or is Ingress enough? https://www.nginx.com/blog/do-i-need-a-service-mesh/
- Check the specific installation guide https://kubernetes.github.io/ingress-nginx/deploy/
- Tutorial setup https://medium.com/analytics-vidhya/configuration-of-kubernetes-k8-services-with-nginx-ingress-controller-5e2c5e896582
- Comprehensive Tutorial by Red Hat https://redhat-scholars.github.io/kubernetes-tutorial/kubernetes-tutorial/ingress.html
- Using Ingress on Kind cluster https://kind.sigs.k8s.io/docs/user/ingress/#ingress-nginx
- More on installing ingress on kind https://dustinspecker.com/posts/test-ingress-in-kind/
Install
The installation will slightly depend on the type of cluster that you are using.
For this tutorial, we are going to be using the docker-desktop cluster
We need two main components
-
Ingress Controller
-
Ingress resources
Note that depending on the Ingress controller that you are using for your Ingress, the Ingress resource that has to be applied to your cluster will be different. In this tutorial, I am using the Ingress Nginx controller.
Let's set everything up.
We are going to be using the NGINX Ingress Controller. With the NGINX Ingress Controller for Kubernetes, you get basic load balancing, SSL/TLS termination, support for URI rewrites, and upstream SSL/TLS encryption
First off, let's clone this repository: https://github.com/AnaisUrlichs/ingress-example
git clone <repository>
cd ingress-example
cd app-one
now build your Docker image
docker build -t anaisurlichs/flask-one:1.0 .
You can test it out through
docker run -p 8080:8080 anaisurlichs/flask-one:1.0
And then we are going to push the image to our Docker Hub
docker push anaisurlichs/flask-one:1.0
We are going to do the same in our second example application
cd ..
cd app-two
build the docker image
docker build -t anaisurlichs/flask-two:1.0 .
push it to your Docker Hub
docker push anaisurlichs/flask-two:1.0
Now apply the deployment-one.yaml and the deployment-tow.yaml
kubectl apply -f deployment-one.yaml
kubectl apply -f deployment-two.yaml
Make sure they are running correctly
kubectl get all
Installing Ingress Controller
kubectl apply -f https://raw.githubusercontent.com/kubernetes/ingress-nginx/controller-v0.44.0/deploy/static/provider/cloud/deploy.yaml
Installing Ingress Resource
kubectl apply -f ingress.yaml
make sure that everything is running correctly
kubectl get all -n ingress-nginx
Making paths happen https://github.com/kubernetes/ingress-nginx/issues/3762
Setup Istio from scratch
100Days Resources
- Video by Anais Urlichs
- Add your blog posts, videos etc. related to the topic here!
Learning Resources
-
Istio cli "istioctl" https://istio.io/latest/docs/setup/install/istioctl/
-
To use kind and ingress together have a look at this blog post https://mjpitz.com/blog/2020/10/21/local-ingress-domains-kind/
-
Using the first part of this blog post https://www.arthurkoziel.com/running-knative-with-istio-in-kind/ (if you want to set-up knative on your kind cluster, be my guest, I also have a whole video on using kind)
However, this is not the focus today.
Have a look at the previous day on Service Mesh
Example Notes
Service Mesh vs Ingress
We would not want to create a LoadBalancer for all of our Services to access each and every individual Service. This is where Ingress comes in. Ingress allows us to configure the traffic to all of our microservice applications. This way, we can easier manage the traffic.
Now to manage the connection between services, we would want to configure a Service Mesh such as Istio. Istio will then take care of the communication between our microservice applications within our cluster. However, it will not take care of external traffic automatically. Instead, what Istio will do is to use an Istio Ingress Gateway that will allow users to access applications from outside the Kubernetes cluster.
The difference here is using the Kubernetes Ingress Resource vs. the Istio Ingress Resource. Have a look at the following blog post that provides comprehensive detail on the differences:
Installation
Prerequisites
- Docker desktop installed https://www.docker.com/products/docker-desktop
- Kind binary installed so that you can run kind commands https://kind.sigs.k8s.io/docs/user/quick-start/
Set-up the kind cluster for using Ingress
In the previous tutorial on Ingress, we used Docker Desktop as our local cluster. You can also set-up Ingress with a kind cluster.
You can configure your kind cluster through a yaml file. In our case, we want to be able to expose some ports through the cluster, so we have to specify this within the config.
Before we create a kind cluster, save the following configurations in a kind-config.yaml file.
kind: Cluster
apiVersion: kind.x-k8s.io/v1alpha4
nodes:
- role: control-plane
  kubeadmConfigPatches:
  - |
    kind: InitConfiguration
    nodeRegistration:
      kubeletExtraArgs:
        node-labels: "ingress-ready=true"
  extraPortMappings:
  - containerPort: 80
    hostPort: 80
    protocol: TCP
  - containerPort: 443
    hostPort: 443
    protocol: TCP
This file is going to be used in the following command when we create out kind cluster.
kind create cluster --config kind-config.yaml --name istio-test
Now you should be on your cluster istio-test. In your kubectl config context the cluster will be called kind-istio-test.
kubectl config get-contexts
kind get clusters
You can then follow the documentation on setting up different Ingress Controllers on top
Install Istio
Install Istio with the following commands if you are on Linux, check out other installation options.
curl -L https://istio.io/downloadIstio | sh -
Now you have to move the package into your usr/bin directory so you can access it through the command line.
sudo mv /Downloads/istio-1.9.1/bin/istioctl /usr/local/bin/
When you run now the following, you should see the version of istioctl
istioctl version
Awesome! we are ready to install istio on our kind cluster.
We are going to use the following Istio configurations and then going to use istioctl to install everything on our kind cluster.
istioctl install --set profile=demo
Note that you can use another istio profile, other than the default one.
Let's check that everything is set-up correctly
kubectl get pods -n istio-system
You should have two pods running right now.
You can check whether everything is working properly through the following command
istioctl manifest generate --set profile=demo | istioctl verify-install -f -
By default, Istio will set the Ingress type to Loadbalancer. However, on a local kind cluster, we cannot use Loadbalancer. Instead, we have to use NodePort and set the host configurations. Create a file called patch-ingressgateway-nodeport.yaml with the following content:
spec:
  type: NodePort
  ports:
  - name: http2
    nodePort: 32000
    port: 80
    protocol: TCP
    targetPort: 80
And then apply the patch with
kubectl patch service istio-ingressgateway -n istio-system --patch "$(cat patch-ingressgateway-nodeport.yaml)"
However, in our Docker Desktop cluster, we are connected to localhost automatically so in that case, we do not have to change anything to NodePort.
Next, we have to allow Istio to communicated with our default namespace:
kubectl label namespace default istio-injection=enabled
Set-up Ingress Gateway
From here onwards, we are just following the documentation
Setting-up the example application:
https://istio.io/latest/docs/examples/bookinfo/
Setting-up metrics:
https://istio.io/latest/docs/tasks/observability/metrics/tcp-metrics/
If you feel ready for a challenge, try out canary updates with Istio
https://istio.io/latest/docs/setup/upgrade/canary/
Deploy an app to CIVO k3s cluster from scratch
100Days Resources
Learning Resources
- Video by Rajesh Radhakrishnan
- CIVO cli essentials
- CIVO marketplace
- Part 1 - Full Stack deployment
- Part 2 - MicroFrontend deployment
CIVO Notes
Ideas to production, CIVO helped me to make it happen...
A rough sketch on the application I came up with an application that help us create a book cover and add chapters to it. In order to build this, I thought of having an angular frontend that communicates to three .net core backend services.
Login and Create a K3s cluster in CIVO I am using my Windows Linux System to learn K8s, also in CIVO creating a k3s cluster is really fast. Once you have the cluster, using the CIVO cli, merge the kubconfig to interact with the cluster using 'kubectl' command. Also K9s tools is also very useful to navigate through the custer. A a few handy commands I will share it to set it up. Once you download the cli, refer to the Learning resource section with useful links:
civo apikey add <clustername> <apikey>
civo apikey current <clustername>
civo region current NYC1
civo kubernetes ls
civo kubernetes config  "PROJECT"-infra --save --merge

kubectl config get-contexts
kubectl config set-context "PROJECT"-infra
kubectl config use-context "PROJECT"-infra
Dockerize the microservices
1. Create a docker file in each microservices.
2. Build & push the images to docker Hub.
3. Create a CI/CD pipeline to deploy to CIVO

docker build . -f Dockerfile -t PROJECT-web:local
docker tag "PROJECT"-web:local <tag>/ "PROJECT"-web:v.0.2
docker push <TAG>/ PROJECT-web:v.0.2
Deploy using openfaas
1. Install the Openfaas from the CIVO marketplace.
2. Download the openfaas cli and connect to CIVO repo.
3. Push the image to the openfaas repo.

curl -sLSf https://cli.openfaas.com | sudo sh
export OPENFAAS_PREFIX="<tag>/"
export DNS="<YOUR_CIVO_CLUSTER_ID>.k8s.civo.com" # As per dashboard
export OPENFAAS_URL=http://$DNS:31112
PASSWORD=$(kubectl get secret -n openfaas basic-auth -o jsonpath="{.data.basic-auth-password}" | base64 --decode; echo)
echo -n $PASSWORD | faas-cli login --username admin --password-stdin

faas-cli new --lang dockerfile api
faas-cli build
faas-cli push -f stack.yml # Contains all the image deployment
faas-cli deploy -f stack.idserver.yml # individual deployment
faas-cli deploy -f stack.web.yml
Deploy using helm
1. Create a helm chart
2. Mention the docker image for the installation
3. Helm install to the CIVO cluster

helm upgrade --install "PROJECT"-frontend /"PROJECT"-web/conf/charts/"PROJECT"-ui --namespace PROJECT --set app.image=<TAG>/"PROJECT"-web:latest
helm uninstall "PROJECT"-frontend -n "PROJECT"
Setup the SSL certificates us Let's Encrypt
1. Create an LetsEncrypt PROD issuer.
2. Deploy the ingress.
3. Troubleshoot and verify the certificated is issued.

kubectl apply -f ./cert-manager/civoissuer.stage.yaml
issuer.cert-manager.io/letsencrypt-stage created
kubectl apply -f ingress-cert-civo.yaml

kubectl get issuer -n kitchen
kubectl get ing -n kitchen
kubectl get certificates -n kitchen
kubectl get certificaterequest -n kitchen
kubectl describe order  -n kitchen
kubectl describe challenges -n kitchen
Show off I used to document the process and steps I have done during the development & deployment. It will help us to review and refine it as we progress through our development
Rancher Shared Service using Kubernauts & Popeye setup
Get the free life time access to RaaS from https://kubernautic.com/
kubectl apply -f https://rancher.kubernautic.com/v3/import/<youraccesskey>.yaml
clusterrole.rbac.authorization.k8s.io/proxy-clusterrole-kubeapiserver created
clusterrolebinding.rbac.authorization.k8s.io/proxy-role-binding-kubernetes-master created
namespace/cattle-system created
serviceaccount/cattle created
clusterrolebinding.rbac.authorization.k8s.io/cattle-admin-binding created
secret/cattle-credentials-c9b86c5 created
clusterrole.rbac.authorization.k8s.io/cattle-admin created
deployment.apps/cattle-cluster-agent created

wget https://github.com/derailed/popeye/releases/download/v0.9.0/popeye_Linux_x86_64.tar.gz
tar -xvf  popeye_Linux_x86_64.tar.gz
mv popeye /usr/local/bin/

POPEYE_REPORT_DIR=/mnt/e/Kubernetes/ popeye --save --out html --output-file report.html
Resources
CrashLoopBackOff
100Days Resources
- Video by Anais Urlichs
- Add your blog posts, videos etc. related to the topic here!
Learning Resources
- What is Kubernetes: https://youtu.be/VnvRFRk_51k
- Kubernetes architecture explained: https://youtu.be/umXEmn3cMWY
Example Notes
Today I actually spent my time first learning about ReplicaSets. However, when looking at my cluster, I have noticed something strange.
There was one pod still running that I thought I had deleted yesterday.
The status of the pod indicated "CrashLoopBackOff"; meaning the pod would fail every time it was trying to start. It will start, fail, start fail, start f...
This is quite common, and in case the restart policy of the pod is set to always, Kubernetes will try to restart the pod every time it has an error.
There are several reasons why the pod would end up in this poor state:
- Something is wrong within our Kubernetes cluster
- The pod is configured correctly
- Something is wrong with the application
In this case, it was easier to identify what had gotten wrong that resulted in this misbehaved pod.
Like mentioned in previous days, there are multiple ways that one can create a pod. This can be categorized roughly into
- Imperative: We have to tell Kubernetes each step that it has to do within our cluster
- Declarative: We provide Kubernetes with any resource definition that we want to set-up within our pod and it will figure out the steps that are needed to make it happen
As part of yesterdays learning, I tried to set-up a container image inside a pod and inside our cluster with the following command:
kubectl create deployment --image=
this will create a deployment resource, based on which a pod is created, based on which a container is run within the created pod.
Going back to reasons this might have resulted in a CrashLoopBackOff; I don't have reasons to believe that something is wrong within our cluster since the same image was created using a pod definition in a declarative format — that worked.
Next, the pod could be configured correctly. This could have been the case — However, since we did not tell Kubernetes explicitly how it should create the pod, we don't have much control over this aspect.
Lastly, the application inside of the container is wrong. I have reason to believe that this is the case. When parsing the container image into the Kubernetes cluster, we did not provide any arguments. However, the container image would have needed an argument to know which image it is actually supposed to run. Thus, I am settling for this explanation.
Now how do we get rid of the pod or correct this?
I first tried to delete the pod with
kubectl delete pod <name of the pod>
However, this just meant that the current instance of the pod was deleted and a new one created each time — counting the restarts from 0.
So it must be that there is another resource that tells Kubernetes "create this pod and run the container inside"
Let's take a look at the original command:
kubectl create deployment --image=
I had literally told Kubernetes to create a deployment. SO let's check for deployment:
kubectl get deployment
and tada, here is the fish.
Since we have already tried to delete the pod, we will now delete the deployment itself.
kubectl delete deployment <name of the deployment>
When we are now looking at our pods
kubectl get pods
We should not see any more pods listed.
Terminology Primer
This section is intended as a quick primer to get you up to speed with the various terms and acronyms that you are likely to encounter as you begin your Kubernetes journey. This is by no means an exhaustive list and it will certainly evolve.
-
Containers: Containers are a standard package of software that allows you to bundle (or package) an application's code, dependencies, and configuration into a single object which can then be deployed in any environment. Containers isolate the software from its underlying environment.
-
Container Image: According to Docker, a Container Image "is a lightweight, standalone, executable package of software that includes everything needed to run an application: code, runtime, system tools, system libraries, and settings." Container Images become Containers at runtime.
-
Container Registry: A container registry is a repository for storing all of your container images. Examples of containers registries are: 'Azure Container Registry', 'Docker Hub', and 'Amazon Elastic Container Registry'.
-
Docker: Docker is an open-source platform used for automating the deployment of containerized applications.
-
Kubernetes: Also know as K8s, Kubernetes is an open-source system for automating the deployment, scaling, and management of containerized applications. Please see kubernetes.io for more details. It could also be thought of as a 'Container Orchestrator'.
-
Control Plane: The control plane is the container orchestration layer. It exposes an API that allows you to manage your cluster and its resources.
-
Namespaces: Namespaces are units of the organization. They allow you to group related resources.
-
Nodes: Nodes are worker machines in Kubernetes. Nodes can be virtual or physical. Kubernetes runs workloads by placing containers into Pods that run on Nodes. You will typically have multiple nodes in your Kubernetes cluster.
-
Pods: Pods are the smallest deployable unit of computing that you can create and manage in Kubernetes. A pod is a group of one or more containers.
-
Service: A Service in Kubernetes is a networking abstraction for Pod access. It handles the network traffic to a Pod or set of Pods.
-
Cluster: A Kubernetes Cluster is a set of nodes.
-
Replica Sets: A Replica Set works to ensure that the defined number of Pods are running in the Cluster at all times.
-
Kubectl: Kubectl is a command-line tool for interacting with a Kubernetes API Server to manage your Cluster.
-
etcd: Etcd is a key-value store that Kubernetes uses to store Cluster data.
-
Ingress: An object that manages external access to the services running on the Cluster.
-
K3s: K3s is a lightweight Kubernetes distribution designed for IoT or Edge computing scenarios.
-
GitOps: According to Codefresh, "GitOps is a set of best-practices where the entire code delivery process is controlled via Git, including infrastructure and application definition as code and automation to complete updates and rollbacks."
-
Containerd: Containerd is a container runtime that manages the complete container lifecycle.
-
Service Mesh: According to Istio, a Service Mesh describes the network of micro-services within an application and the communications between them.
-
AKS: Azure Kubernetes Service (AKS) is a managed, hosted, Kubernetes service provided by Microsoft Azure. A lot of the management of your Kubernetes cluster is abstracted away and managed by Azure. Find out more here.
-
EKS: Elastic Kubernetes Service (EKS), provided by Amazon AWS, is a managed, hosted, Kubernetes service. Similar to AKS, much of the management is abstracted away and managed by the cloud provider. Find out more here
-
GKE: Google Kubernetes Engine (GKE), is another managed Kubernetes service. This time from Google. Find out more here.
-
Helm: Helm can be thought of as a Package Manager for Kubernetes.
-
Helm Chart: Helm Charts are YAML files that define, install and upgrade Kubernetes applications.